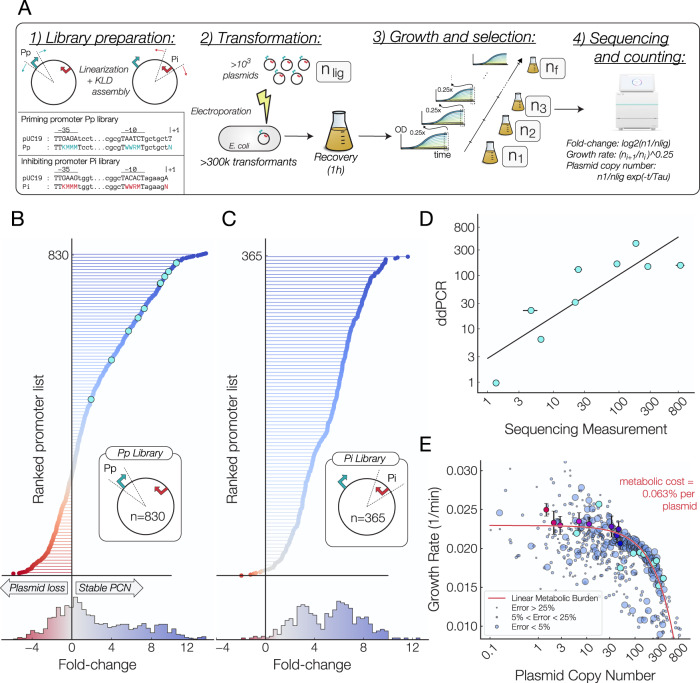
Fig. 4. Massively parallelized copy number assay.
A Procedure for massively parallelized copy number assay. 1) The promoter upstream of the priming RNA was randomized with site directed mutagenesis. 2) Plasmids were ligated and cells were transformed with this library of plasmids with high efficiency and grown until OD600 of 1.0. 3) At which point a fraction of the culture was diluted and regrown and the remaining fraction was saved for plasmid extraction. 4) Sequencing libraries were generated from isolated plasmids and sequenced using next generation sequencing. Growth rates and Plasmid Copy Numbers (PCN) were then calculated from the frequencies of sequencing counts present at each time point. B Ranked list of the measured fold-change for plasmids generated through mutations to the promoter driving the priming RNA in this work (n = 830). Promoters with a fold-change below zero will result in plasmid loss (PCN < 1). (lower) The distribution of copy numbers arising from mutations to the priming RNA promoter. C Ranked list of the measured fold-change for plasmids generated through mutations to the promoter driving the inhibitory RNA in this work (n = 365). D Agreement between plasmid copy number as measured by sequencing counts and digital droplet PCR. Data points are averages over n = 3 biological replicates, error bars = std. dev. E The relationship between plasmid copy number and growth rate as measured across 830 variants of the pUC19 plasmid. The size of each data point is inversely proportional to the error in the measurement, with the top, middle two and lowest quartiles representing an error of less than 5%, between 5% and 25%, and more than 25%, respectively. Data from Fig. 1E is plotted (red to blue gradient points) A linear metabolic burden seems to account for the observed relation reduction in growth rate with increasing copy number. Data points represent average over n = 3 measurements.

