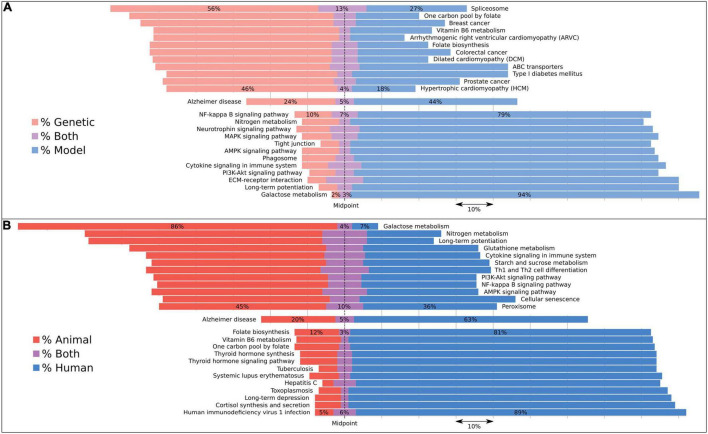
FIGURE 3.
Pathways associated with AD subcategorized by evidence type using dictionaries to reveal biases in their associations. Bars are aligned along the midpoint of the neutral grouping, so that a direct comparison can be made of the two competing groups. The missing percentage from this chart is for studies assigned to neither evidence category, but this value can be inferred by subtracting the total bar quantity from 100, or found in Supplementary Table 5. We compared (A) genetic with model studies and (B) animal with human studies. We included the 12 most skewed pathways for each of these four evidence types as well as the Alzheimer’s disease pathway, which represents the AD expected rate for each category. Both human and animal studies were included under the model category. Pathways with less than 100 studies associating them to dementia were excluded.

