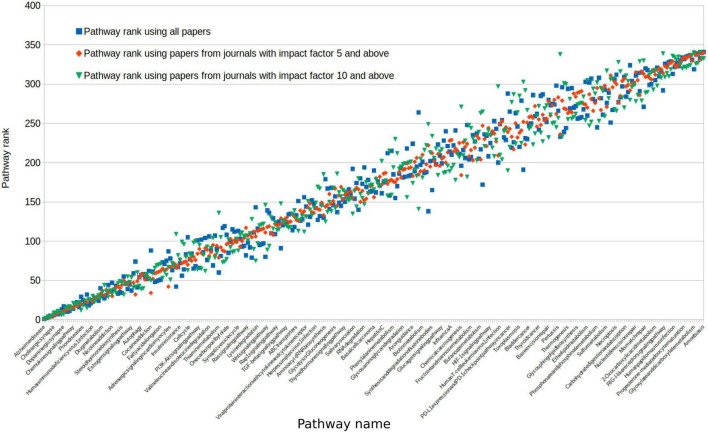
FIGURE 5.
We reassessed all pathway ranks after selecting journal sources with a differing impact. Impact of greater than 5 (red) or greater than 10 (green) comparing this to all studies from any journal (blue). For clarity, pathways on this figure were ordered by the average rank across these three groups. Because of this, the variability in impact >5 (red) falsely appears to be less, as it is a halfway point between the other two scores.

