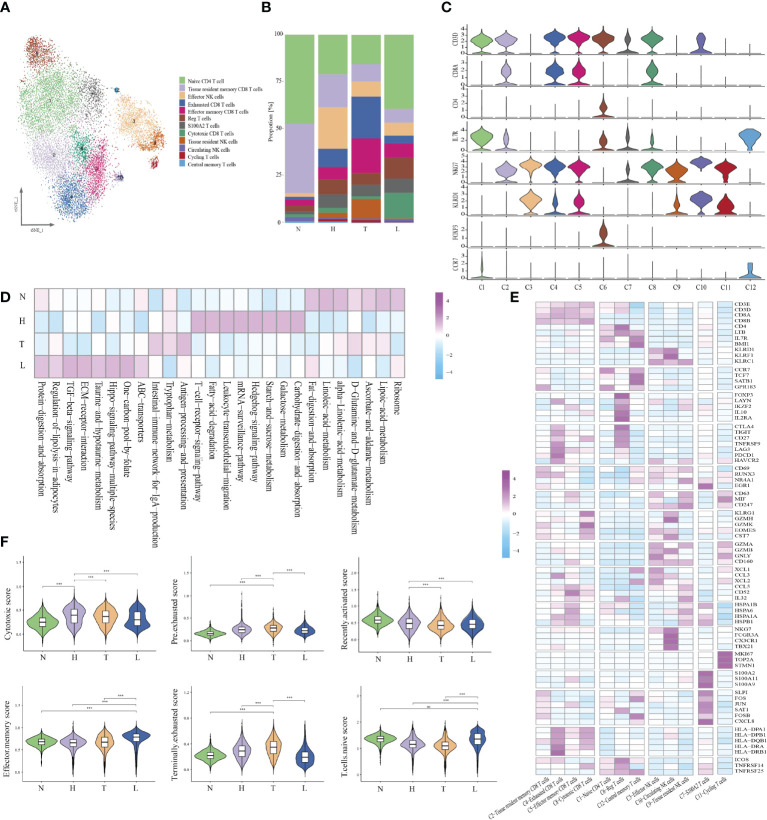
Figure 2.
Identifying distinct NK/T cell clusters in all samples. t-SNE projection of 12 subsets of NK/T cells (each dot corresponds to one single cell) (A). Proportions of all cell types clusters in each group (B). Violin plots presenting the distribution module score for selected genes for each group (C). Heatmap indicating the expression of selected gene sets in NK/T subtypes (D). Heatmap indicating the enrichment of signaling pathway in four groups (GSVA KEGG) (E). Violin plots showing the scores of functional modules for four groups, using the AddModuleScore function. Error bars indicated the means ± SD. (***P < 0.001). NS, no significant (F).

