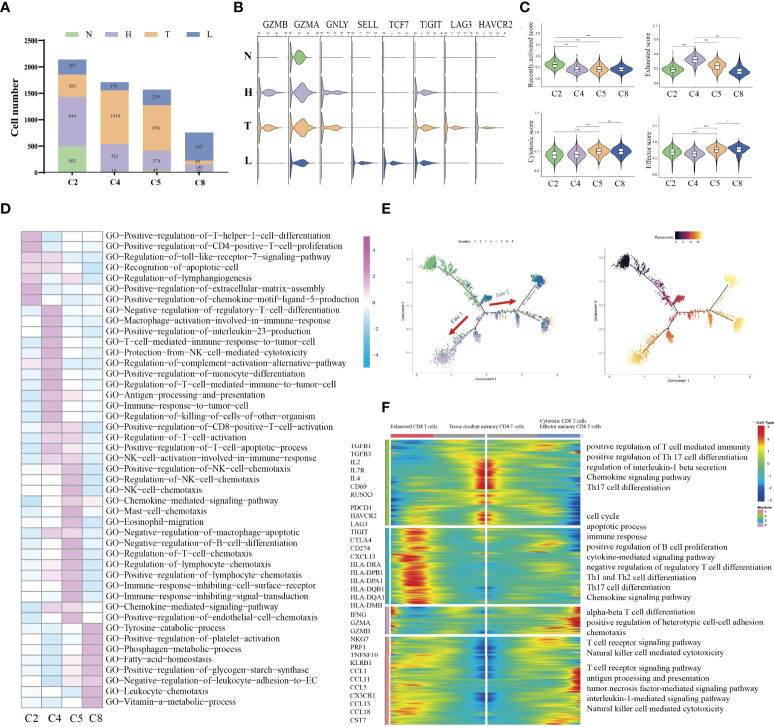
Figure 3.
Difference of immune state among four groups (N, H, T, and L). Proportions of each CD8+ T cell cluster among four groups (A). Violin plots showing the distribution module score for selected genes for each CD8+ T cells cluster. Error bars indicated the means ± SD (B). Violin plots showing the scores of functional modules for each cell CD8+ T cluster, using the AddModuleScore function. (*P < 0.05; ***P < 0.001) (C). Heatmap indicating the enrichment of signaling pathway among four CD8+ T cells cluster (GSVA GO) (D). Trajectory of all CD8+ T cell clusters from all group along pseudotime in a two-dimensional state-space defined by Monocle2. Each point corresponds to a single cell, and each color represents a CD8+ T cell cluster (E). Heatmap indicating the differentially expressed genes (rows) along the pseudotime (F). NS, no significant.

