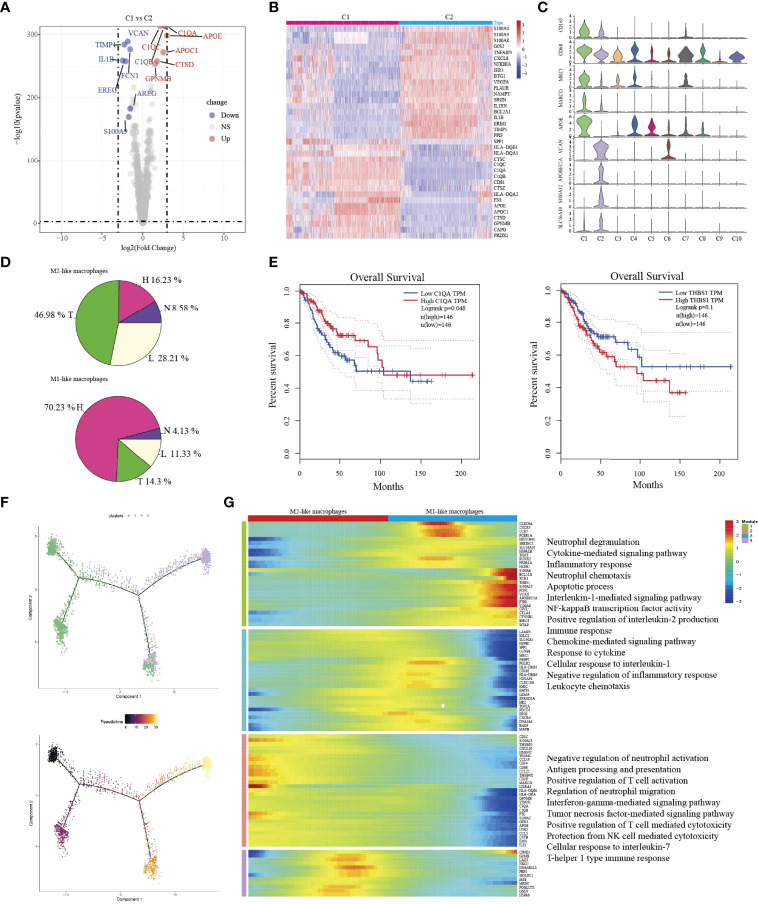
Figure 5.
The transition of two types of macrophages during tumor progression. Volcano plot showing the top differently genes between two types of macrophages (A). Heatmap indicating differently genes between two types of macrophages (B). Violin plots showing the distribution module score for selected genes for each cluster. Error bars indicated the means ± SD (C). Pie graph showing the proportions of cells among four groups (D). Kaplan–Meier curve showing survival of C1QA, and THBS1 genes in TCGA-SCC patients (E). Trajectory of both two macrophage clusters along pseudotime in a two-dimensional state-space defined by Monocle2. Each point corresponds to a single cell, and each color represents a macrophage cluster (F). Heatmap indicating the differentially expressed genes (rows) along the pseudotime (G).

