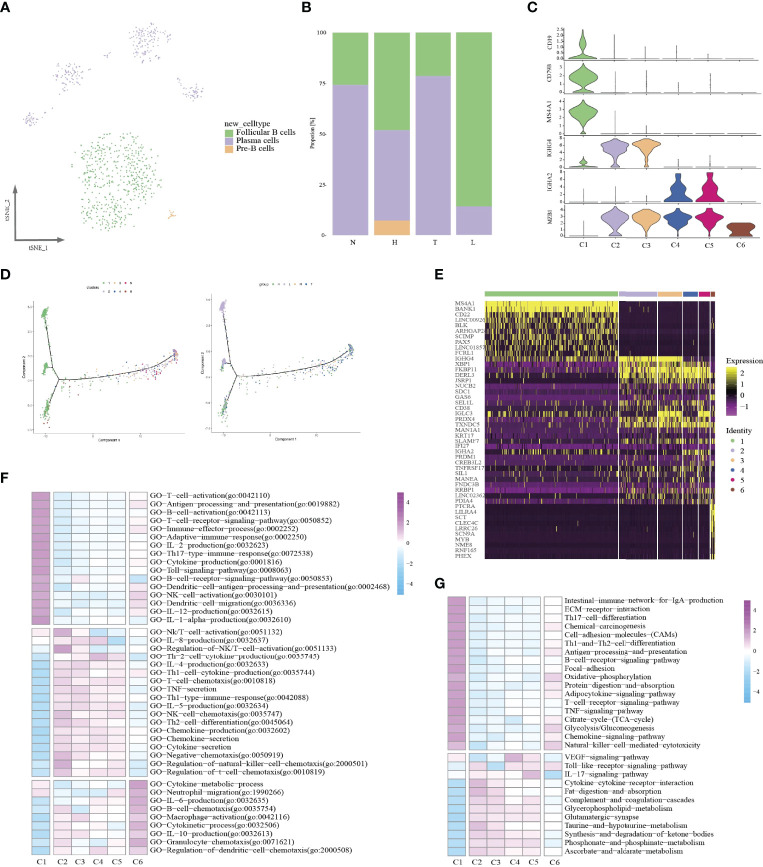
Figure 6.
Identifying distinct B cell clusters in all samples. t-SNE projection of three cell types of B cells (each dot corresponds to one single cell) shown in different colors (A). Proportions of all cell types clusters among four groups (B). Violin plots representing the distribution module score for selected genes for each cluster. Error bars indicated the means ± SD (C). Trajectory of all B cell clusters along pseudotime in a two-dimensional state-space defined by Monocle2. Each point corresponds to a single cell (D). Heatmap indicating differently genes among six clusters (E). Heatmap showing the enrichment of biological function in six B cell clusters (GSVA GO) (F). Heatmap showing the enrichment of biological function in six B cell clusters (GSVA KEGG) (G).

