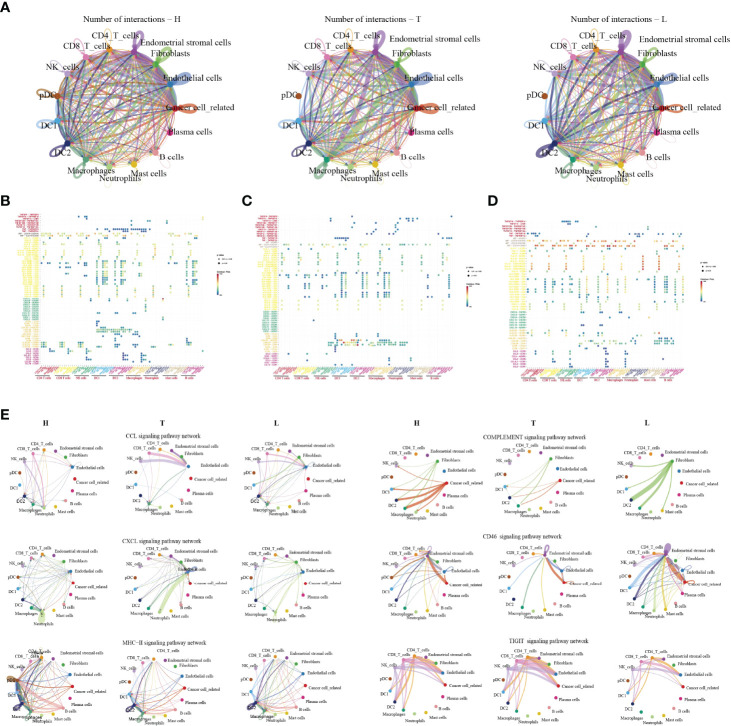
Figure 7.
The dense network and multiple cellular connections. Circos plot showing the interactions between ligands and receptors across cell types in HSIL(left), tumor (middle), and lymph node (right) (A). Bubble diagram showing MHC moleculars, immune receptors, chemokine and immune checkpint among different immune cells in HSIL (B), tumor (C) and lymph node (D). The association of different signaling pathways among different immune cells in HSIL, tumor and lymph node group (E).

