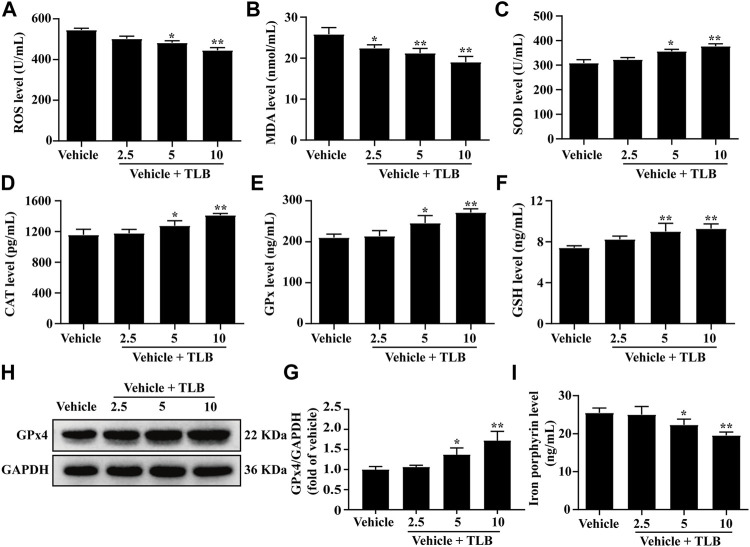
FIGURE 2.
Effect of TLB on EEIF-induced oxidative stress and ferroptosis in mice. (A) ROS level (n = 6), (B) MDA level (n = 6), (C) CAT activity (n = 6), (D) SOD activity (n = 6), (E) GPx activity (n = 6), (F) GSH level (n = 6), (H) representative Western blots of GPx4, (G) quantitation of GPx4 (n = 5), and (I) iron porphyrin level (n = 6). The data were presented as the mean ± SEM. * p < 0.05 and ** p < 0.01 vs vehicle group.

