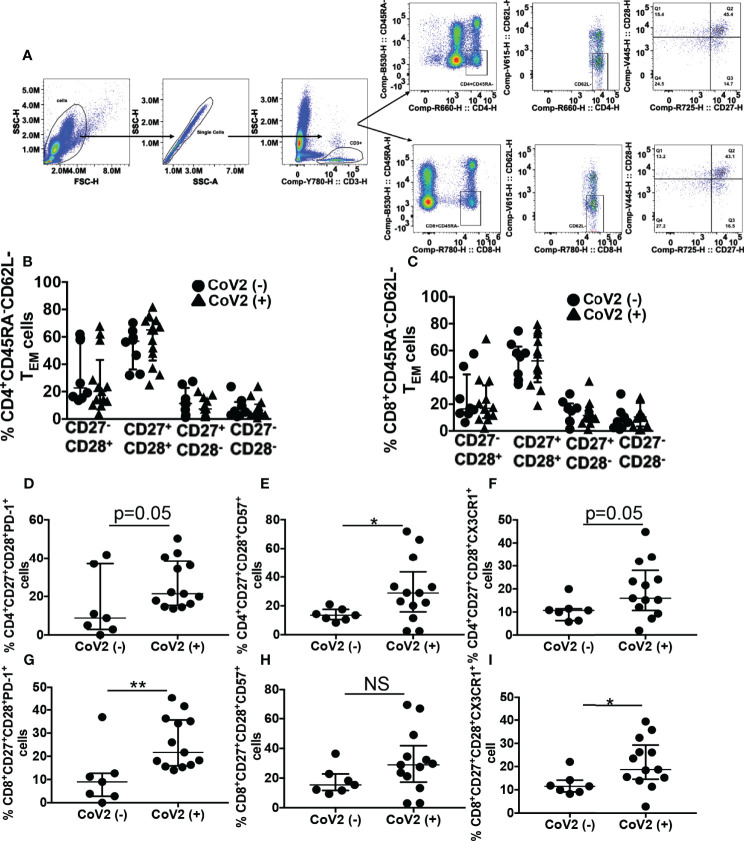
Figure 2.
CoV2+ individuals exhibit an aberrant T cell phenotype 5 months after the first detection of infection: Heparinized blood obtained from CoV2- and CoV2+ individuals was stained with anti-CD3, -CD4, -CD8, -CD45RA, -CD62L, CD27, -CD28, -CD57, -PD-1 and -CX3CR1 antibodies. (A–C) Cells were analyzed for various T memory cell subsets as indicated. (A) Gating strategy for T cells is shown (B, C) Percentages of T memory cells are shown. (D–F) Percentages of PD-1+, CD57+ and CX3CR1+ cells in CD3+CD4+CD45RA-CD62L-CD27+CD28+ T memory cell subset (G–I) Percentages of PD-1+, CD57+ and CX3CR1+ cells in CD3+CD8+CD45RA-CD62L-CD27+CD28+ T memory cell subset is shown. For all, each dot in the plots depicts data of each individual donor, the plots include observations from 25th to 75th percentile. The horizontal line represents the median value. *p < 0.05; **p < 0.005 NS, Non-significant.

