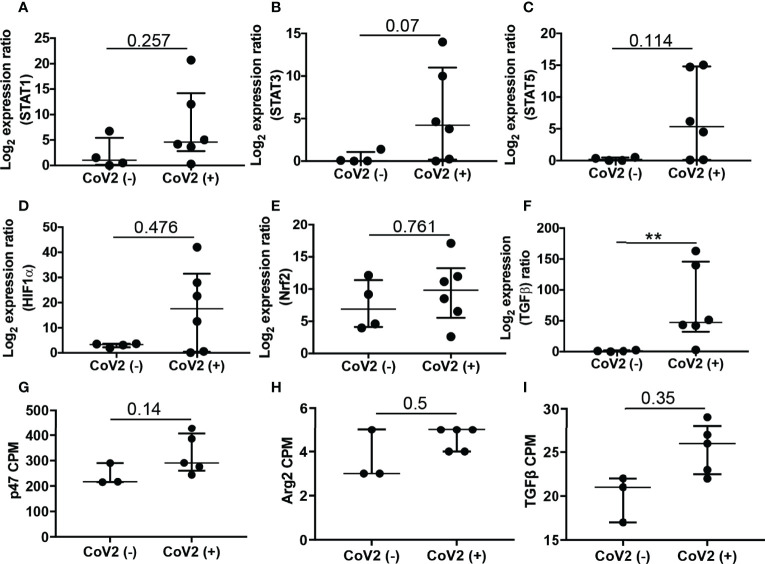
Figure 6.
Expression of genes associated with expansion and function of M-MDSC: Freshly isolated PBMC from CoV2- and CoV2+ individuals were stained with anti-CD14 and -HLA DR antibodies; CD14+HLA DR-/lo M-MDSC were sorted by flow cytometry and stored in Trizol. (A–F) RNA was isolated and the expression of indicated genes was determined by qRT PCR as detailed in Methods. (G–I) Expression of indicated genes was plotted from RNA-Seq data, as counts per million (cpm). For all, each dot in the plots depicts data of each individual donor, the plots include observations from 25th to 75th percentile. The horizontal line represents the median value. p-values are shown, **p < 0.005; nominal p-values are indicated for the RNA-Seq data.

