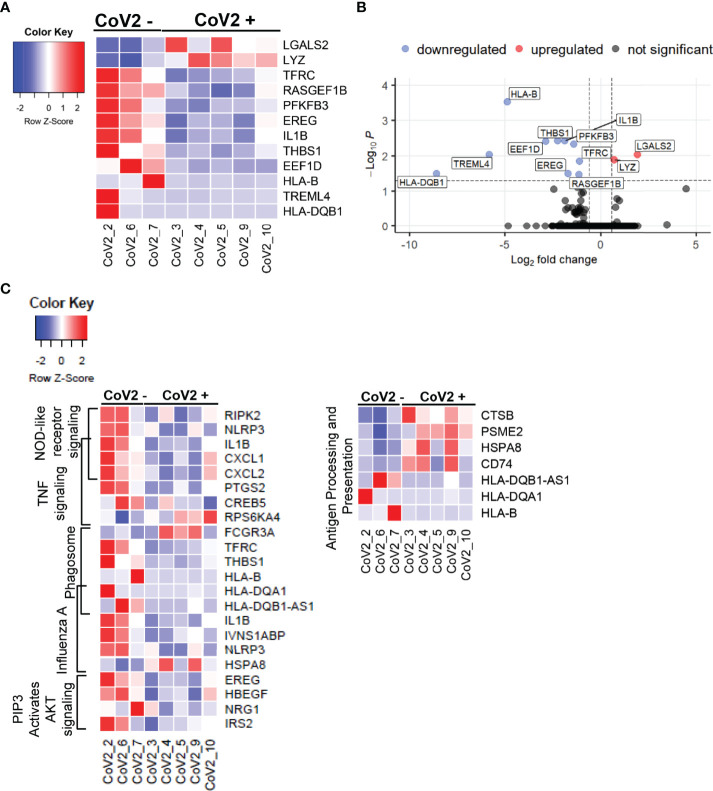
Figure 7.
CoV2 infection induces long-term changes in global gene expression profiles: Differentially expressed genes in M-MDSC isolated from CoV2- and CoV2+ individuals were identified using EdgeR. (A) Heatmap was constructed using function heatmap.2 from the library gplots in R. For the heatmap construction, samples were arranged by group (Cov2- followed by CoV2+), and genes were arranged by the average fold change in expression CoV2+/CoV2- (greatest to least); construction of dendrograms was omitted. Gene expression was scaled by row; scale bar represents scaled gene expression values. (B) Volcano plot was constructed using EnhancedVolcano function from the library EnhancedVolcano in R. The input for the volcano plot consisted of gene symbols along with logFC and FDR from the EdgeR differential gene expression analysis output. Vertical dash lines represent the fold change cut off (greater than 1.5 or less than -1.5); horizontal dash line represents the FDR cut off (less than 0.05). (C) Heatmaps were constructed for genes (nominal p < 0.05) from selected pathways (indicated on the left of the heatmaps). Samples were arranged by group (Cov2- followed by CoV2+). Genes were arranged by pathway; genes mapped to two pathways were added to the heatmap once at their overlap.

