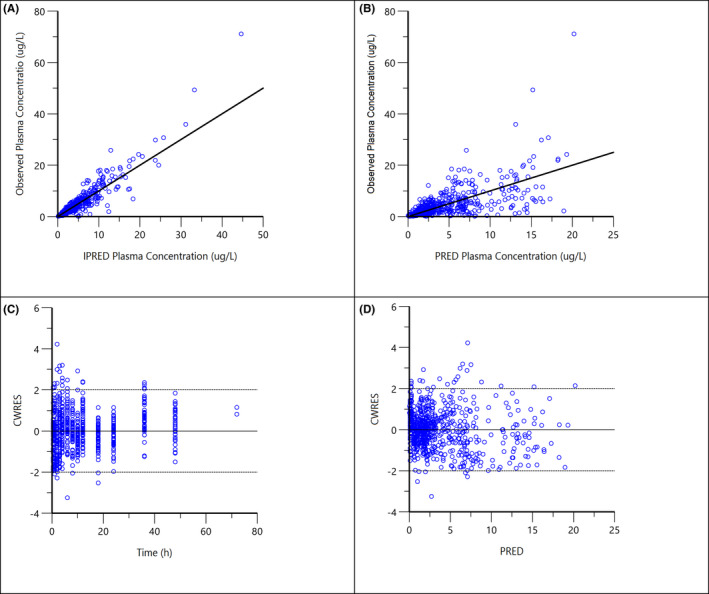
FIGURE 4.

Diagnostic plots for the final population PK model of atorvastatin: (A) observed concentrations vs. individual predicted concentrations (IPRED); (B) observed concentrations vs. population predicted concentrations (PRED); (C) conditional weighted residuals (CWRES) vs. time after dose; (D) CWRES vs. population predicted concentrations (PRED)
