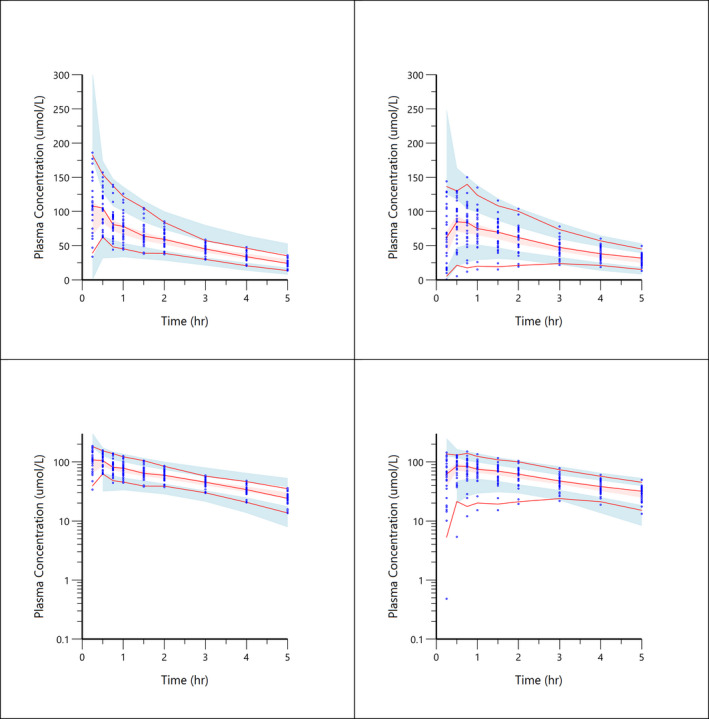
FIGURE 5.

Visual predictive check plots for paracetamol concentration‐time data. Top left shows paracetamol combined with placebo. Top right shows paracetamol co‐administration with semaglutide. Low left shows paracetamol combined with placebo on a log scale. Lower right shows paracetamol co‐administration with semaglutide on a log scale. Solid red line represents the 5th, median and 95th quantiles of the observed data; shaded areas represent the 95% prediction intervals for corresponding simulated data
