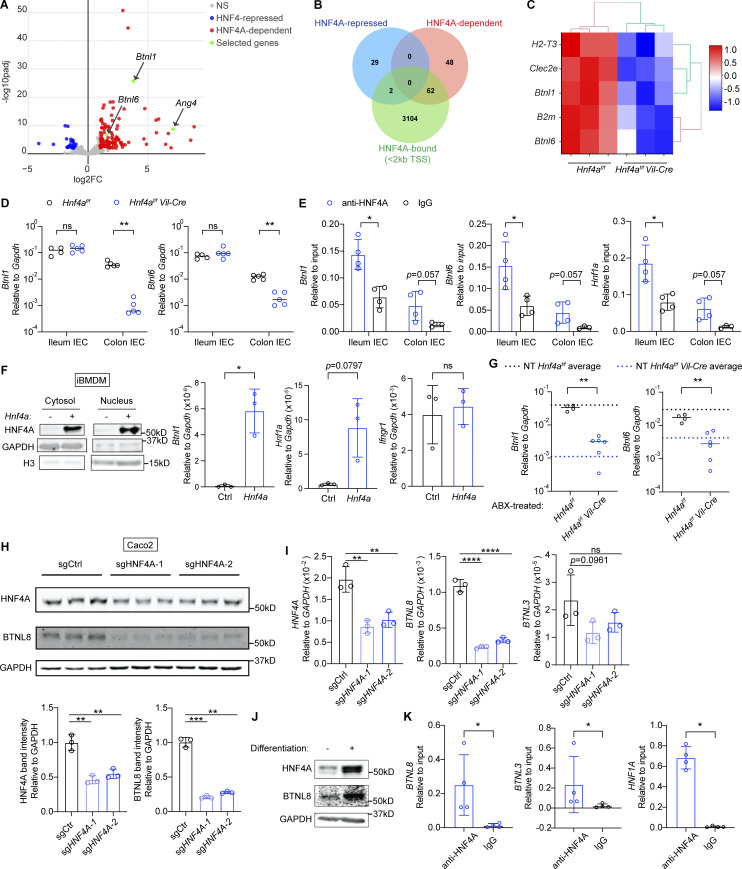
Figure 2.
HNF4A directly regulates Btnls and other immune signaling molecules. All mice in this figure were 9–12-wk-old young adult unless stated otherwise. (A) Gene expression was determined by RNA-seq using sorted cecal IECs. Volcano plot displaying the fold change and adjusted P value of DE genes enriched in the WT (red) and Hnf4aIEC-KO (blue). Selected DE genes were highlighted (green) and annotated by arrows. Non-DE genes, gray. N = 3 for each genotype. (B) Venn diagram showing the overlap of DE genes with genes that contained HNF4A binding sites within 2 kb of TSS (ChIP-seq dataset GSM1266727). (C) Relative expression of representative immune signaling molecules in the HNF4A-dependent and HNF4A-bound group was shown as heatmap. Each column represented one biological replicate. (D) Expression of Btnl1 and Btnl6 in the ileal and colonic IECs was determined by qPCR and shown as 2−dCt. Median. N = 4–5 for each group. (E) HNF4A binding to the promoters of indicated genes was determined by ChIP-qPCR and shown as 2−dCt. Mean with SD. N = 3–4 for each group. (F) Empty vector (Ctrl) or mouse Hnf4a was ectopically expressed in murine iBMDMs. Western blot showing protein levels of HNF4A, GAPDH, and histone H3 in the cytosol and nucleus. qPCR analysis of HNF4A targets was shown as 2−dCt. Mean with SD. N = 3 for each group. (G) Breeders were given antibiotic cocktails (ABX) ad lib from pregnancy and treatment continued after birth of pups. RNA levels of indicated genes in the colonic IECs of 3-wk-old offspring were determined by qPCR and shown as 2−dCT. Average levels of genes in the colonic IECs from nontreated (NT) 3-wk-old mice were indicated by dashed lines. Median. N = 4–6 for each group. (H) Caco2-Cas9 cells were transduced with nontargeting guide RNA (sgCtrl) or two independent guides targeting HNF4A (sgHNF4A-1, sgHNF4A-2). Protein expression of HNF4A, BTNL8, and GAPDH was determined by Western blot. Band intensity was quantified using Fiji and shown below. Replicates were independently transduced cells. Mean with SD. N = 3 for each group. (I) Caco2-Cas9 cells were treated as in H. RNA levels of indicated genes were determined by qPCR and shown as 2−dCT. Mean with SD. N = 3 for each group. (J) Protein expression of HNF4A, BTNL8, and GAPDH in undifferentiated and differentiated Caco2 cells was determined by Western blot. (K) HNF4A binding to the promoters of indicated genes in differentiated Caco2 cells was determined by ChIP-qPCR and shown as 2−dCT. Mean with SD. N = 4 for each group. Each dot represented individual mouse or treatment. Data was combined from two independent experiments or one representative experiment from at least two independent experiments. Data was analyzed by Mann-Whitney tests (D–G and K) and one-way ANOVA (H and I). *, P < 0.0332; **, P < 0.0021; ***, P < 0.0002; ****, P < 0.0001. Source data are available for this figure: SourceData F2.

