Figure 5.
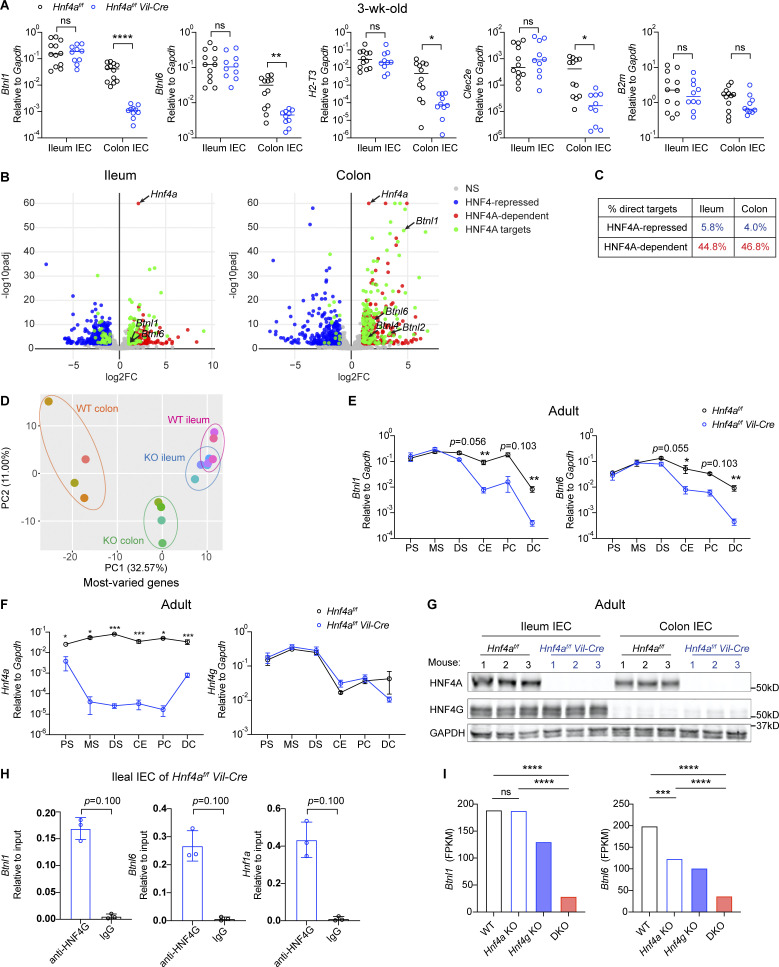
HNF4A and HNF4G regulate immune signaling molecules in a location-specific manner. (A) Expression of indicated immune signaling molecules in the ileal and colonic IECs from 3-wk-old mice was determined by qPCR and shown as 2−dCT. Median. N = 10–12 for each group. (B) RNA-seq analysis of sorted IECs from the ileum and colon of 3-wk-old mice. Volcano plots displaying the fold change and adjusted P value of DE genes enriched in WT (red) and Hnf4aIEC-KO (blue). DE genes containing HNF4A binding sites within 2 kb of TSS were highlighted (green) and annotated by arrows. Non-DE genes, gray. N = 4 for each group. (C) Percentage of HNF4A direct targets in ileal and colonic DE genes was shown. (D) Principal component analysis of most-varied genes was shown. Each dot represented transcriptome from one sample. Samples of the same genotype and tissue origin were grouped by colored ovals. WT ileum (pink), Hnf4aIEC-KO ileum (blue), WT colon (orange), and Hnf4aIEC-KO colon (green). (E) Expression of Btnl1 and Btnl6 along the intestinal tract of young adult mice was determined by qPCR. PS, proximal small intestine; MS, middle small intestine; DS, distal small intestine; CE, cecum; PC, proximal colon; DC, distal colon. Mean with SEM. N = 5–9 for each group. (F) As in E, expression of Hnf4a and Hnf4g along the intestinal tract was determined by qPCR. Mean with SEM. N = 5–9 for each group. (G) Protein levels of HNF4A and HNF4G in the ileal and colonic IECs was determined by Western blot. N = 3 for each group. (H) HNF4G binding to the promoters of indicated genes in the ileal IECs from Hnf4aIEC-KO mice was determined by ChIP-qPCR and shown as 2−dCT. Mean with SD. N = 3 for each group. (I) Levels of Btnl1 and Btnl6 in the duodenal IECs of indicated genotypes. Data was adapted from the RNA-seq dataset GSE112946 (Chen et al., 2019). Mean. N = 3 for each group. Each dot represented individual mouse. Data was combined from at least two independent experiments or one representative experiment of two independent experiments and analyzed by Mann-Whitney tests (A, E, F, and H). *, P < 0.0332; **, P < 0.0021; ***, P < 0.0002; ****, P < 0.0001. Source data are available for this figure: SourceData F5.

