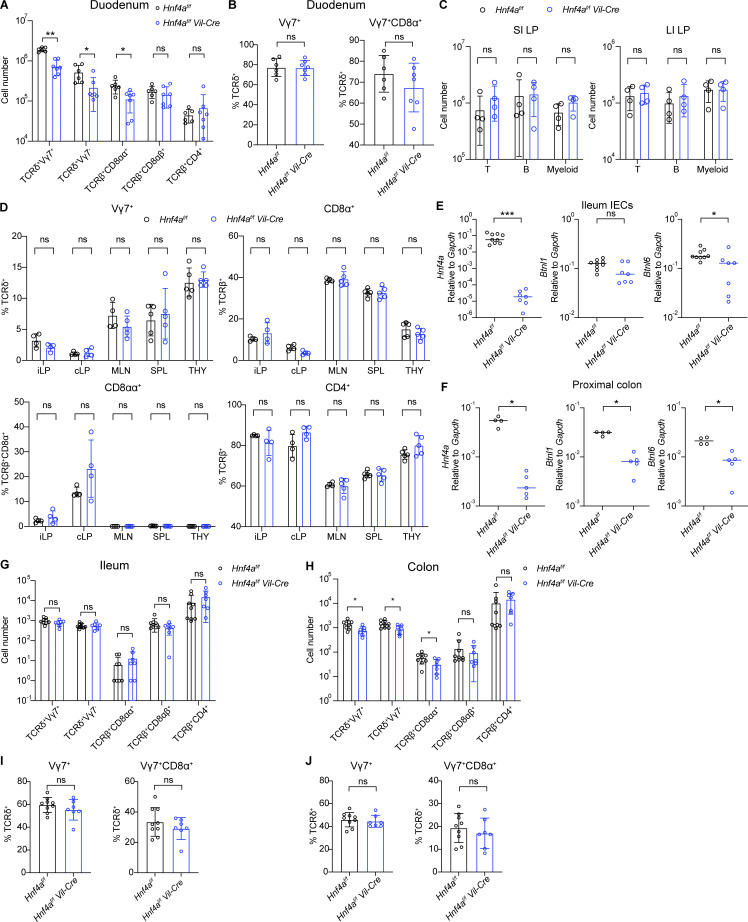
Figure S2.
Immune composition in other tissues and 1-wk-old mice. Related to Figs. 3 and 4. (A–J) Mice were 10–12 wk old in A–D and 6–7 d old in E–J. (A) Cell number of indicated cell subsets in the duodenum of young adult mice. Mean with SD. N = 6–7 for each group. (B) Vγ7+ and Vγ7+CD8α+ percentage out of γδ IELs in the duodenum. Mean with SD. N = 6–7 for each group. (C) General T cell (CD45+CD3+CD19−), B cell (CD45+CD3−CD19+), and myeloid cell (CD45+CD3−CD19−, CD11b+ or CD11c+) numbers in the lamina propria of the small intestine (SI LP) and large intestine (LI LP). Mean with SD. N = 4 for each group. (D) Percentage of indicated cell subsets in the ileal lamina propria (iLP), colonic lamina propria (cLP), mesenteric lymph nodes (MLN), spleens (SPL), and thymus (THY). Mean with SD. N = 4–5 for each group. (E and F) Expression of indicated genes in the ileal IECs (E) and proximal colon (F) of 1-wk-old mice was determined by qPCR and shown as 2−dCT. Median. N = 4–9 for each group. (G and H) Cell number of indicated cell subsets in the ileum (G) and colon (H) of 1-wk-old mice. Mean with SD. N = 7–9 for each group. (I and J) Vγ7+ and Vγ7+CD8α+ percentage out of γδ IELs in the ileum (I) and colon (J). Mean with SD. N = 7–9 for each group. Each dot represented individual mouse. Data was combined from two independent experiments. Data was analyzed by Mann-Whitney tests (A–J). *, P < 0.0332; **, P < 0.0021; ***, P < 0.0002.

