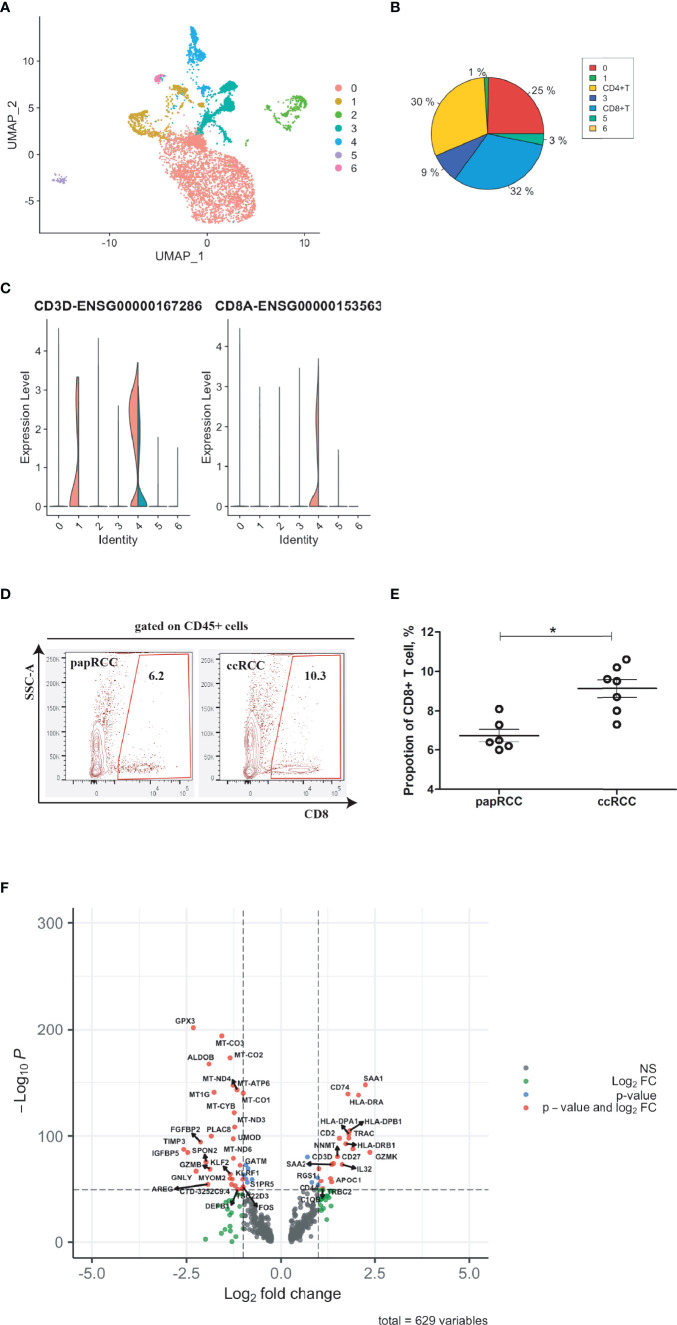
Figure 2.
Identification of CD8+ T cell-related genes in clear cell renal cell carcinoma (ccRCC). Single cell RNA (scRNA) data were presented with UMAP clustering using R package Seurat (https://satijalab.org/seurat/v3.1/integration.html). (A) UMAP plot showing seven cell clusters in integrated ccRCC and papillary renal cell carcinoma (papRCC) biopsies. (B) Pie plot indicating cell proportions in integrated biopsies. (C) Combined violin plots showing the comparison of gene expression levels of T cells and CD8+ T cells between ccRCC (red) and papRCC (cyan). (D) Flow cytometry analysis of CD8+ T cells in RCC patients. Contour plots showed the frequency of CD8+ T cells in RCC biopsies isolated from patients. (E) Dot plot showed statistical analysis of CD8+ T cells in RCC biopsies isolated from patients. Each dot represented one readout. Nonparametric analysis was used. *: p<0.05. (F) Volcano plot showing the distribution of 629 differentially expressed genes (DEGs) expressed by CD8+ T cells (ccRCC vs. papRCC).

