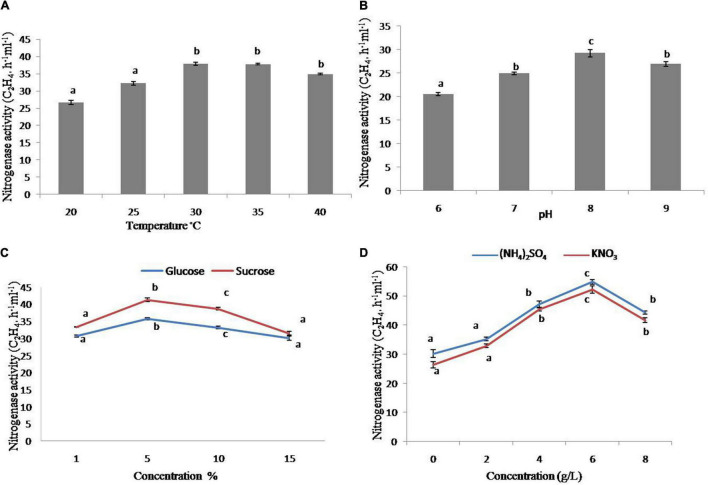
FIGURE 2.
Nitrogenase activity of strain GXS16. (A) Temperature, (B) pH, (C) Glucose and sucrose, (D) (NH4)2SO4 and KNO3. Values are mean, and vertical bars indicate the standard deviation of three replications. Means followed by the same letter within a column are not significantly different (p < 0.05) according to Duncan’s multiple range test (DMRT).

