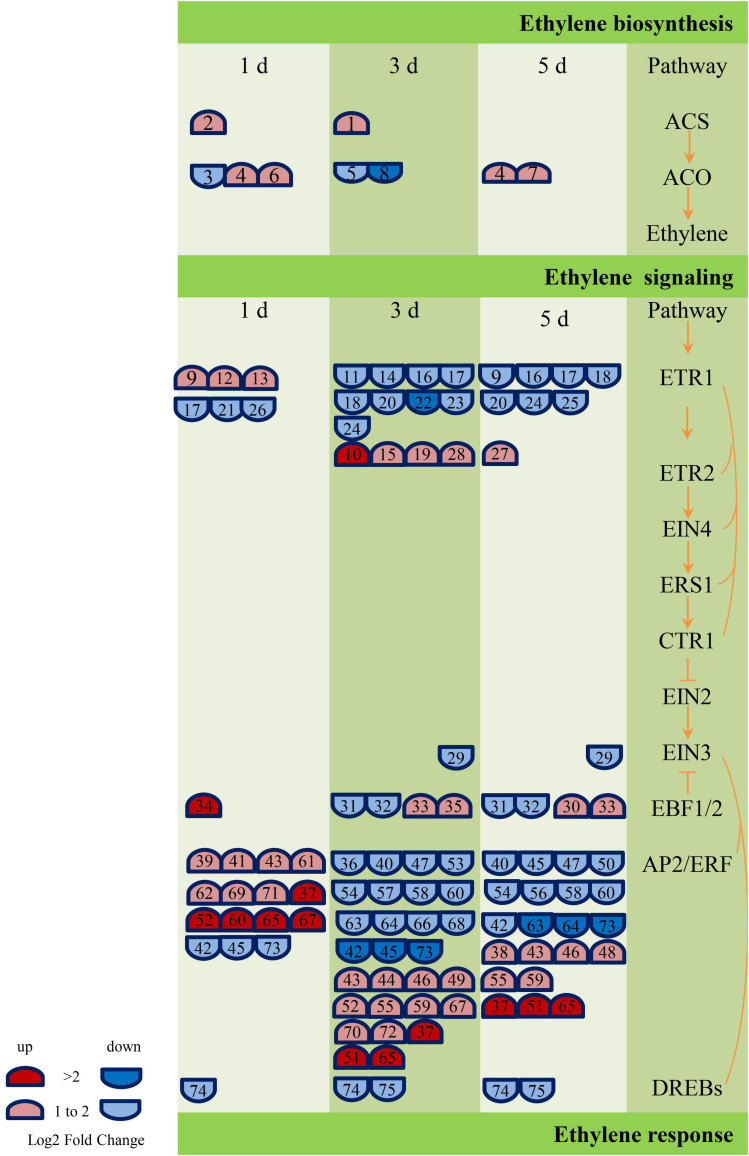
FIGURE 8.
Ethylene biosynthesis and signaling-related genes responses to GXS16 colonization in sugarcane roots. Gene expression levels (log2 fold change) are represented as colors and symbols. Red stands for upregulated and blue stands for downregulated genes. The DEGs are identified with numbers which are illustrated in Supplementary Table 5.

