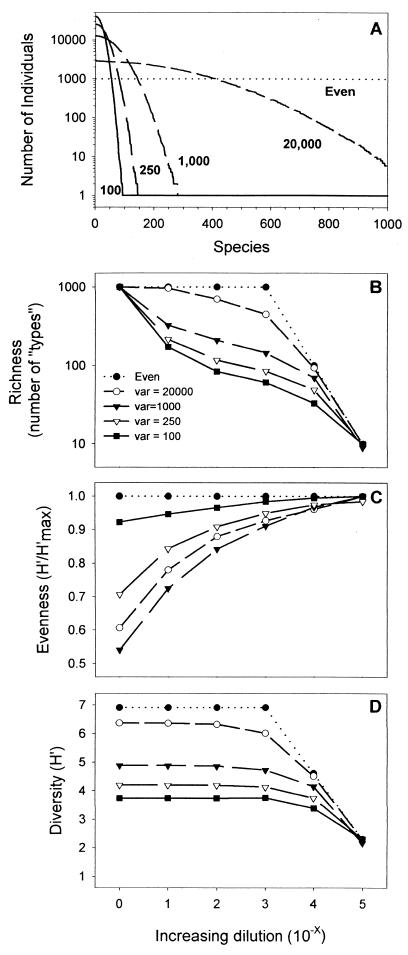
FIG. 1.
(A) Distribution of individuals among 1,000 types in the initial communities used in simulations. Note that both total abundance and richness were the same in each of the five communities. The mean of each distribution was set at 500, and the variance was altered to simulate communities with a dominant (var = 100, 250, or 1,000) or relatively even (var = 20,000 or even) distribution. (B to D) Simulation results showing how community structure differed in the various initial communities for each serial dilution. The x axis represents the negative exponent of the dilution factor (e.g., 4 corresponds to a 10−4 dilution), and the y axis represents richness (number of types or species) (B), evenness (C), or the calculated value of the Shannon-Wiener diversity index (D).

