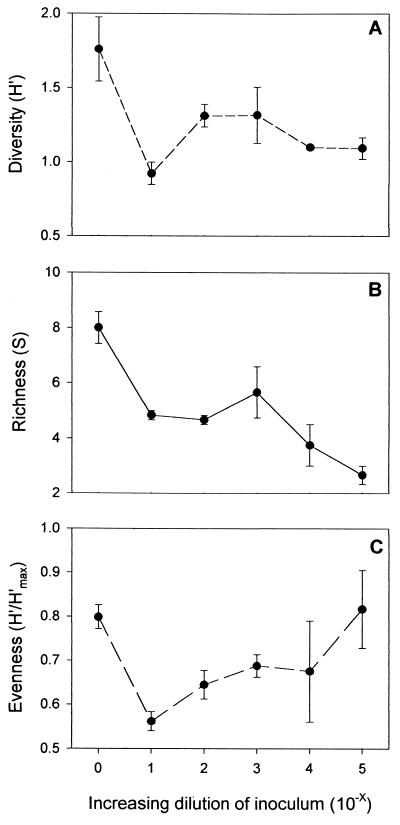
FIG. 2.
Results of R2A colony morphology comparison. All values are reported as the average per R2A plate ± 1 standard error. Each value was calculated by comparing 25 randomly selected colonies on each plate, using two replicate plates per flask and three flasks for each treatment. The sole exception to this was the 10−4 treatment, where only two of the replicate flasks were compared. The x axis in each of these graphs represents the negative exponent of the dilution factor used to create the original inoculum (e.g., 4 corresponds to a 10−4 dilution). The y axis represents diversity of colony morphologies based upon the Shannon-Wiener diversity index (A), richness (the number of distinct colony morphotypes) (B), or evenness (C).

