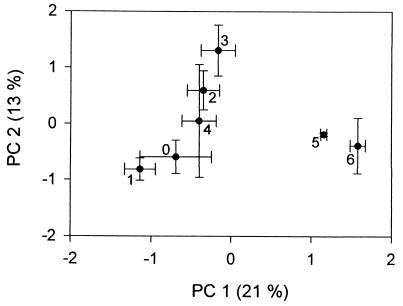
FIG. 3.
Results of PCA of the CLPP data. Each point represents the average for three replicate flasks maintained at each dilution; error bars represent ± 1 standard error. Each treatment is identified by the negative exponent of the dilution factor used to create the original inoculum (e.g., 4 corresponds to a 10−4 dilution). The percentage of variance explained by each PC is provided.

