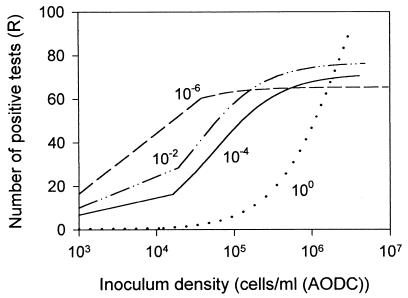
FIG. 4.
Results of dilution-extinction analysis of CLPP for each regrown community. The x axis represents the inoculum density (as measured by AODC) used in each CLPP assay (presented on a log10 scale). The y axis is the number of positive tests for each incubation. The results are presented as fitted lines generated by modeling the untransformed data with a right rectangular hyperbola; the associated regression statistics for this fit are given in Table 2. The curvature of the regression lines at lower inoculum levels is an artifact of the log scaling of the x axis.

