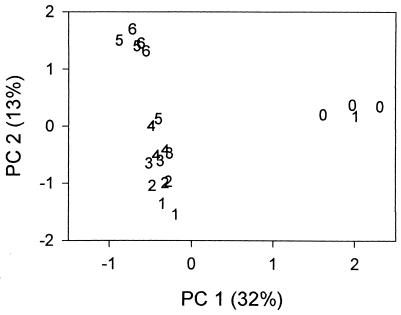
FIG. 5.
Results of PCA of the AFLP profiles. Data are presented for each of three replicate flasks for each treatment, and each value corresponds to the negative exponent of the dilution factor used to create the original inoculum (e.g., 4 corresponds to a 10−4 dilution). The percent variance explained by each PC is provided.

