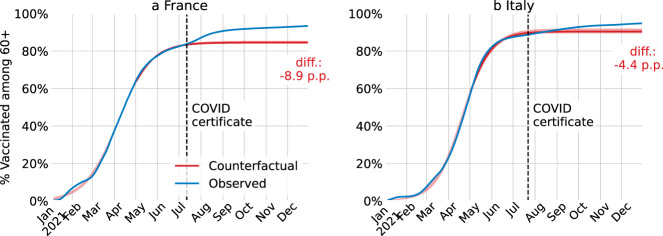
Fig. 6. Realised and counterfactual vaccination rates for the population over age 60.
For France (a) and Italy (b), cumulative proportion of the population over age 60 who received at least one COVID-19 vaccine dose in the actual intervention deployment (blue) and in the no-intervention counterfactual scenario (red). The red shaded area is the 95% confidence interval centred around the main estimate. The counterfactual scenario is estimated via innovation diffusion theory. The black dashed vertical line is the date of the announcement of the COVID certificate.

