
Figure 1.
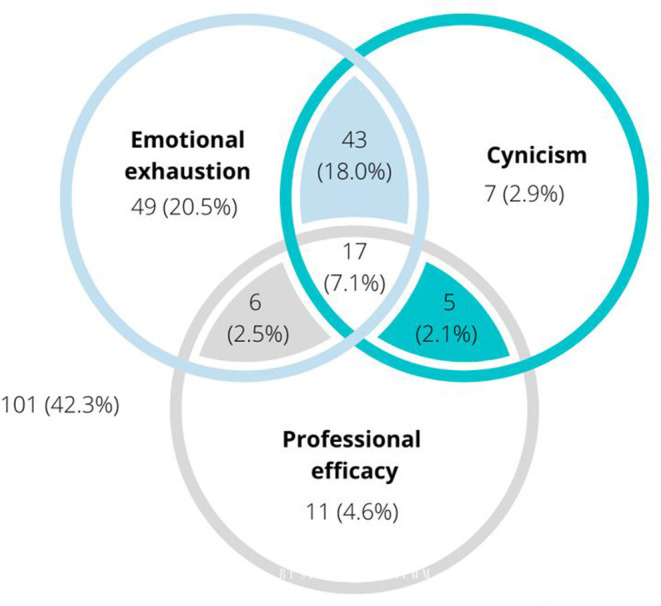
Venn diagram indicating the proportion of MBI respondents (n = 239) reporting symptoms of burnout (emotional exhaustion, cynicism, and profession efficacy) above thresholds. Where symptoms overlap, this indicates the proportion of respondents exceeding thresholds on both symptoms. Where all three symptoms overlap, this indicates the proportion of respondents exceeding thresholds on all three symptoms.