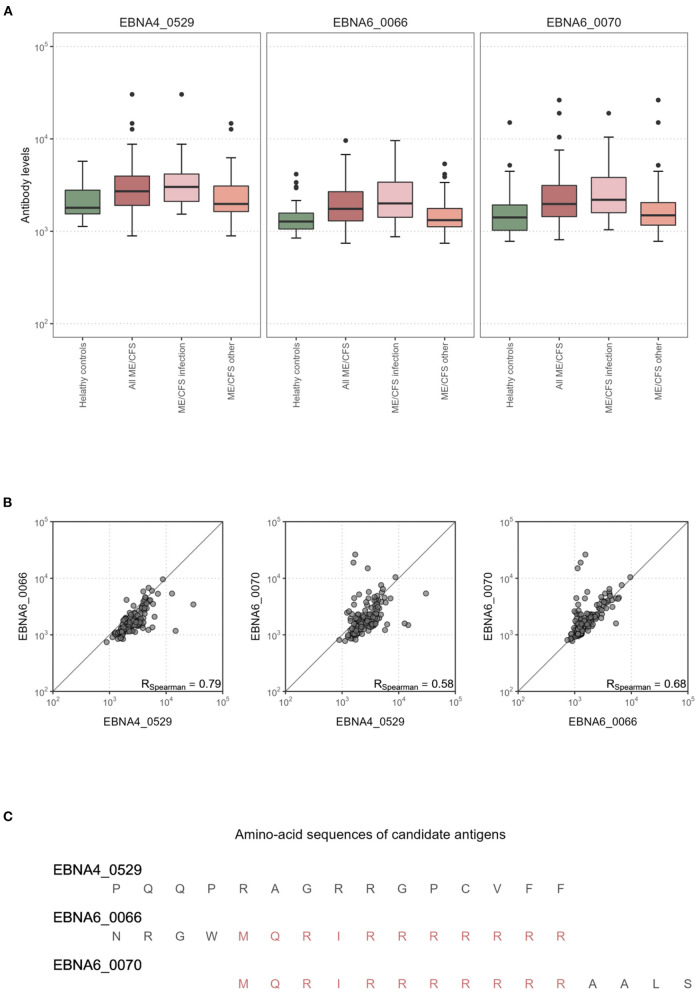
Figure 3.
Statistical analysis of the antibody levels related to EBNA4_0529, EBNA6_0066, and EBNA6_0070. (A) Boxplots of the data per study group. (B) Scatterplots and the respectively Spearman's correlation coefficients (R) in the whole dataset. (C) Amino acid sequences of EBNA4_0529, EBNA6_0066, and EBNA6_0070.

