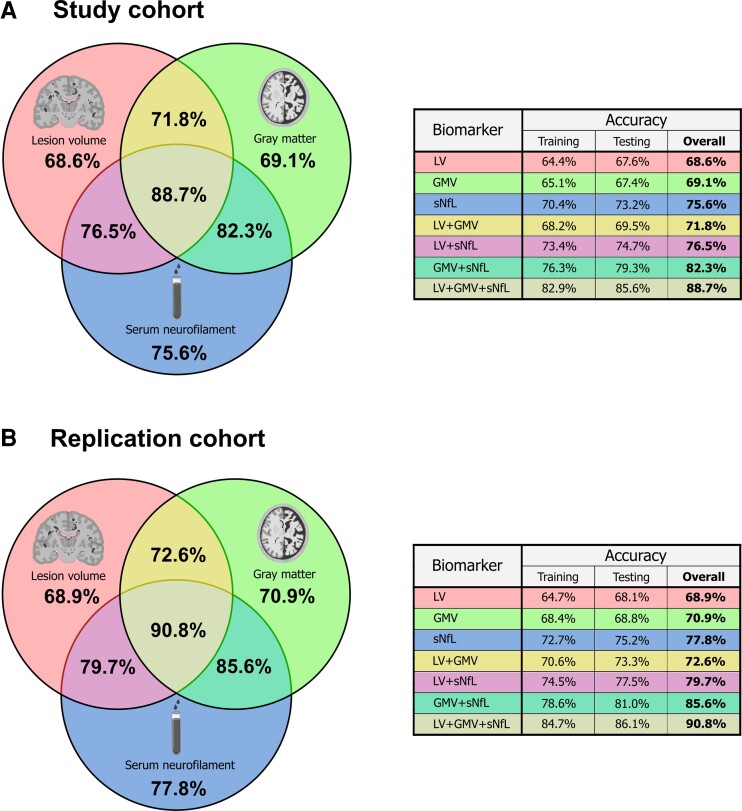
Figure 3.
Cross-validated prediction accuracies for single markers and combinations of markers. Venn diagram depicting the results of the support vector regression analyses and the resultant cross-validated accuracies (A) in the study cohort and (B) in the replication cohort. LV = lesion volume; GMV = grey matter volume; sNfL = serum neurofilament light chain.

