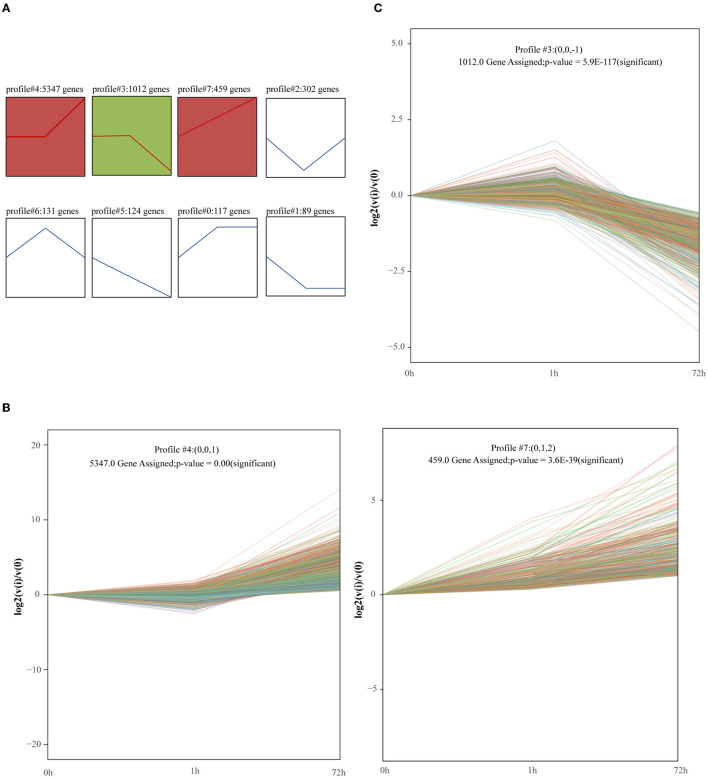
Figure 4.
Short Time-Series Expression Miner (STEM) analysis of gene expression profile. Squares of the same color indicate that the correlation is >0.7. (A) Trend analysis of genes. Gene expression was normalized in the STEM software and genes with maximal values minus minimal values not <1 were included in the analysis. The 7581 genes from 0, 1, and 72 h after MI were clustered into 8 profiles. (B,C) Significantly enriched trend analysis of profile#3, profile#4, and profile#7.

