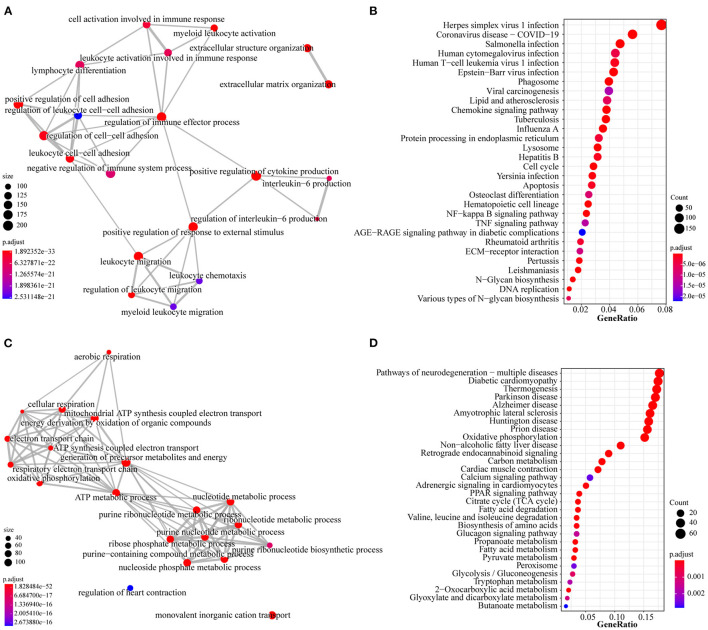
Figure 5.
GO and KEGG analysis of type I profiles (profiles#4 and #7) and type II profile (profile #3). (A) Top 20 items for GO analysis of type I profiles. (B) Top 30 items for KEGG pathway analysis of type I profiles. (C) Top 20 items for GO analysis of type II profile. (D) Top 30 items for KEGG pathway analysis of type II profile. Colors represent adjusted p-value, the size of the dots represents the number of genes enriched into this biological process. The thickness of the line represents how many genes are enriched in common between the two biological processes.

