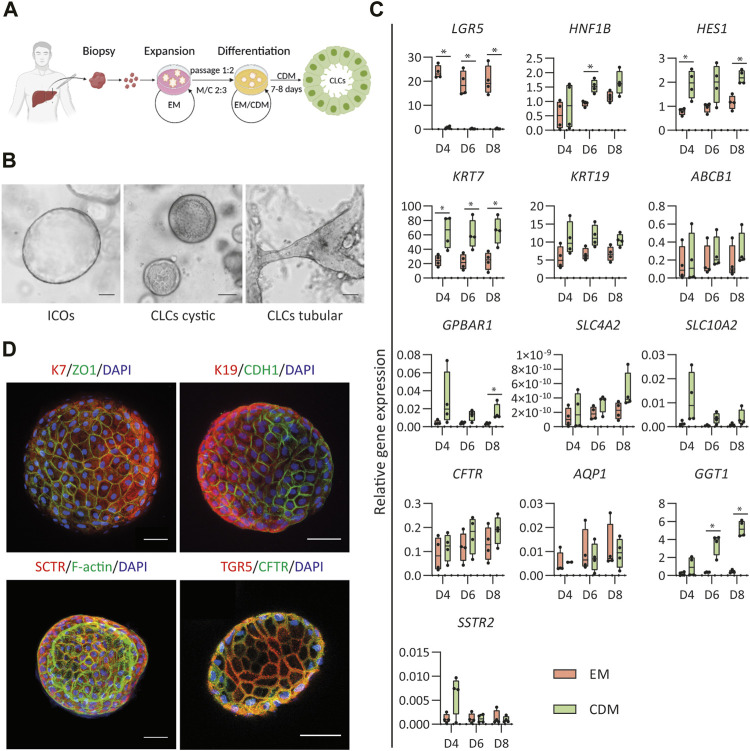
FIGURE 1.
Differentiation of human intrahepatic cholangiocyte organoids (ICOs) toward cholangiocyte-like cells (CLCs). (A) Schematic overview of the protocol for differentiation of human ICOs to CLCs. EM, expansion medium; CDM, cholangiocyte differentiation medium; M/C, Matrigel/collagen type Ⅰ mixture. (B) ICOs in EM condition and cystic/tubular structures of CLCs formed in CDM. Left, ICOs; Middle, CLCs cystic; Right, CLCs tubular structure. Scale bar = 100 μm. (C) Gene expression analysis for ICOs under EM and CDM conditions. N = 4 independent donors for EM and CDM conditions at three time points (days 4, 6, and 8). Results are shown as fold change relative to the human gallbladder for cholangiocyte markers and the liver tissue for adult stem cell markers. Data are shown as box and whisker plots. Center line, median; box, interquartile; whiskers: minimum to maximum, show all points. Statistical differences between groups (EM and CDM) were determined by the two-tailed Mann–Whitney U test (see also Supplementary Table S3). *p < 0.05. (D) Immunofluorescence analysis of the CLCs expression of key cholangiocyte markers. Typically, in a well of a 96-well plate, about 50 organoids are cultured: keratin (K) 7 and K19, transport markers [secretin receptor (SCTR), G protein-coupled bile acid receptor 1 (GPBAR1, also known as TGR5), cystic fibrosis transmembrane conductance regulator (CFTR)], epithelial markers [cadherin 1 (CDH1), and tight junction protein 1 (ZO1)]. In addition, the F-actin is performed on the organoids’ apical surface facing the central lumen. Scale bar = 50 μm.

