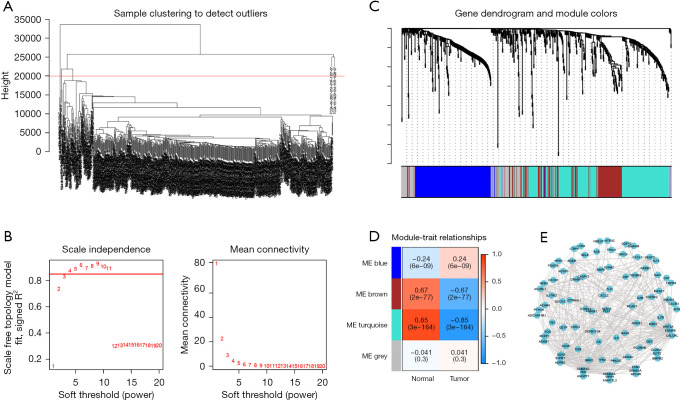
Figure 3.
Identification of hub genes among immune-related DEGs. (A) Two outliers were cut by setting the upper limit at 20,000. (B) The horizontal line in the left graph indicates that the threshold power is 0.85. As shown in the graph, the optimal soft threshold power was 4. (C) The distribution of genes in a dendrogram. (D) Three nongray modules were obtained through WGCNA. (E) The network of the genes in the turquoise module (weight of edge >0.2). ME, module eigengene; DEGs, differentially expressed genes; WGCNA, weighted gene co-expression network analysis.

