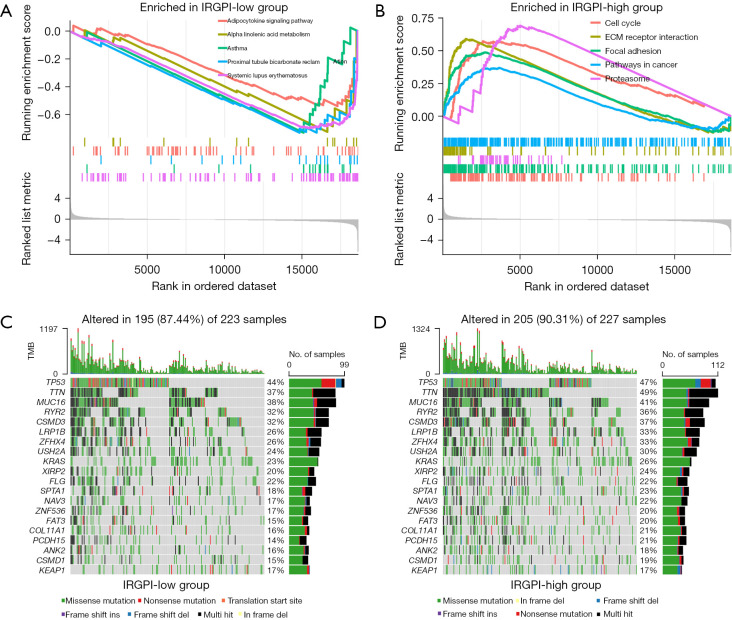
Figure 5.
Molecular characteristics of 2 IRGPI subgroups. (A) Gene sets enriched in IRGPI-low subgroup. (B) Gene sets enriched in IRGPI-high subgroup. (C) Oncoplot displaying the mutation status of IRGPI-low subgroup. Mutated genes are ordered by mutation numbers of the whole sample, with the top 20 genes shown. The colors represent the mutation type. (D) Oncoplot displaying the mutation status of IRGPI-high subgroups. IRGPI, immune-related gene prognostic index; TMB, tumor mutation burden.

