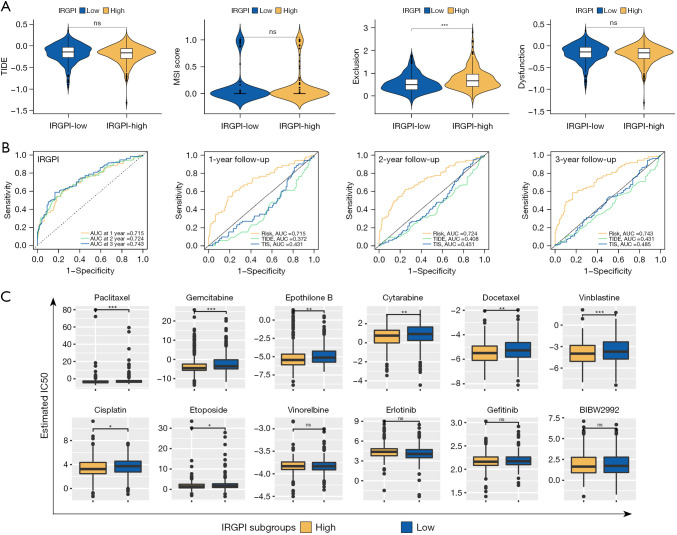
Figure 8.
The prognostic value and response to therapies of the IRGPI. (A) TIDE, MSI, T-cell exclusion, and T-cell dysfunction score in 2 IRGPI subgroups (ns, no significance; ***, P<0.001). (B) Time-dependent ROC analysis of IRGPI, TIS, and TIDE on OS at 1-, 2-, 3-year follow-up in TCGA cohort. (C) Drug sensitivity of 12 drugs between 2 IRGPI subgroups (ns, no significance; *, P<0.05; **, P<0.01; ***, P<0.001). IRGPI, immune-related gene prognostic index; TIDE, Tumor Immune Dysfunction and Exclusion; AUC, areas under the curve; IC50, half-maximal inhibitory concentration; TIS, tumor inflammation signature; MSI, microsatellite instability; ROC, receiver operating characteristic; OS, overall survival; TCGA, The Cancer Genome Atlas.

