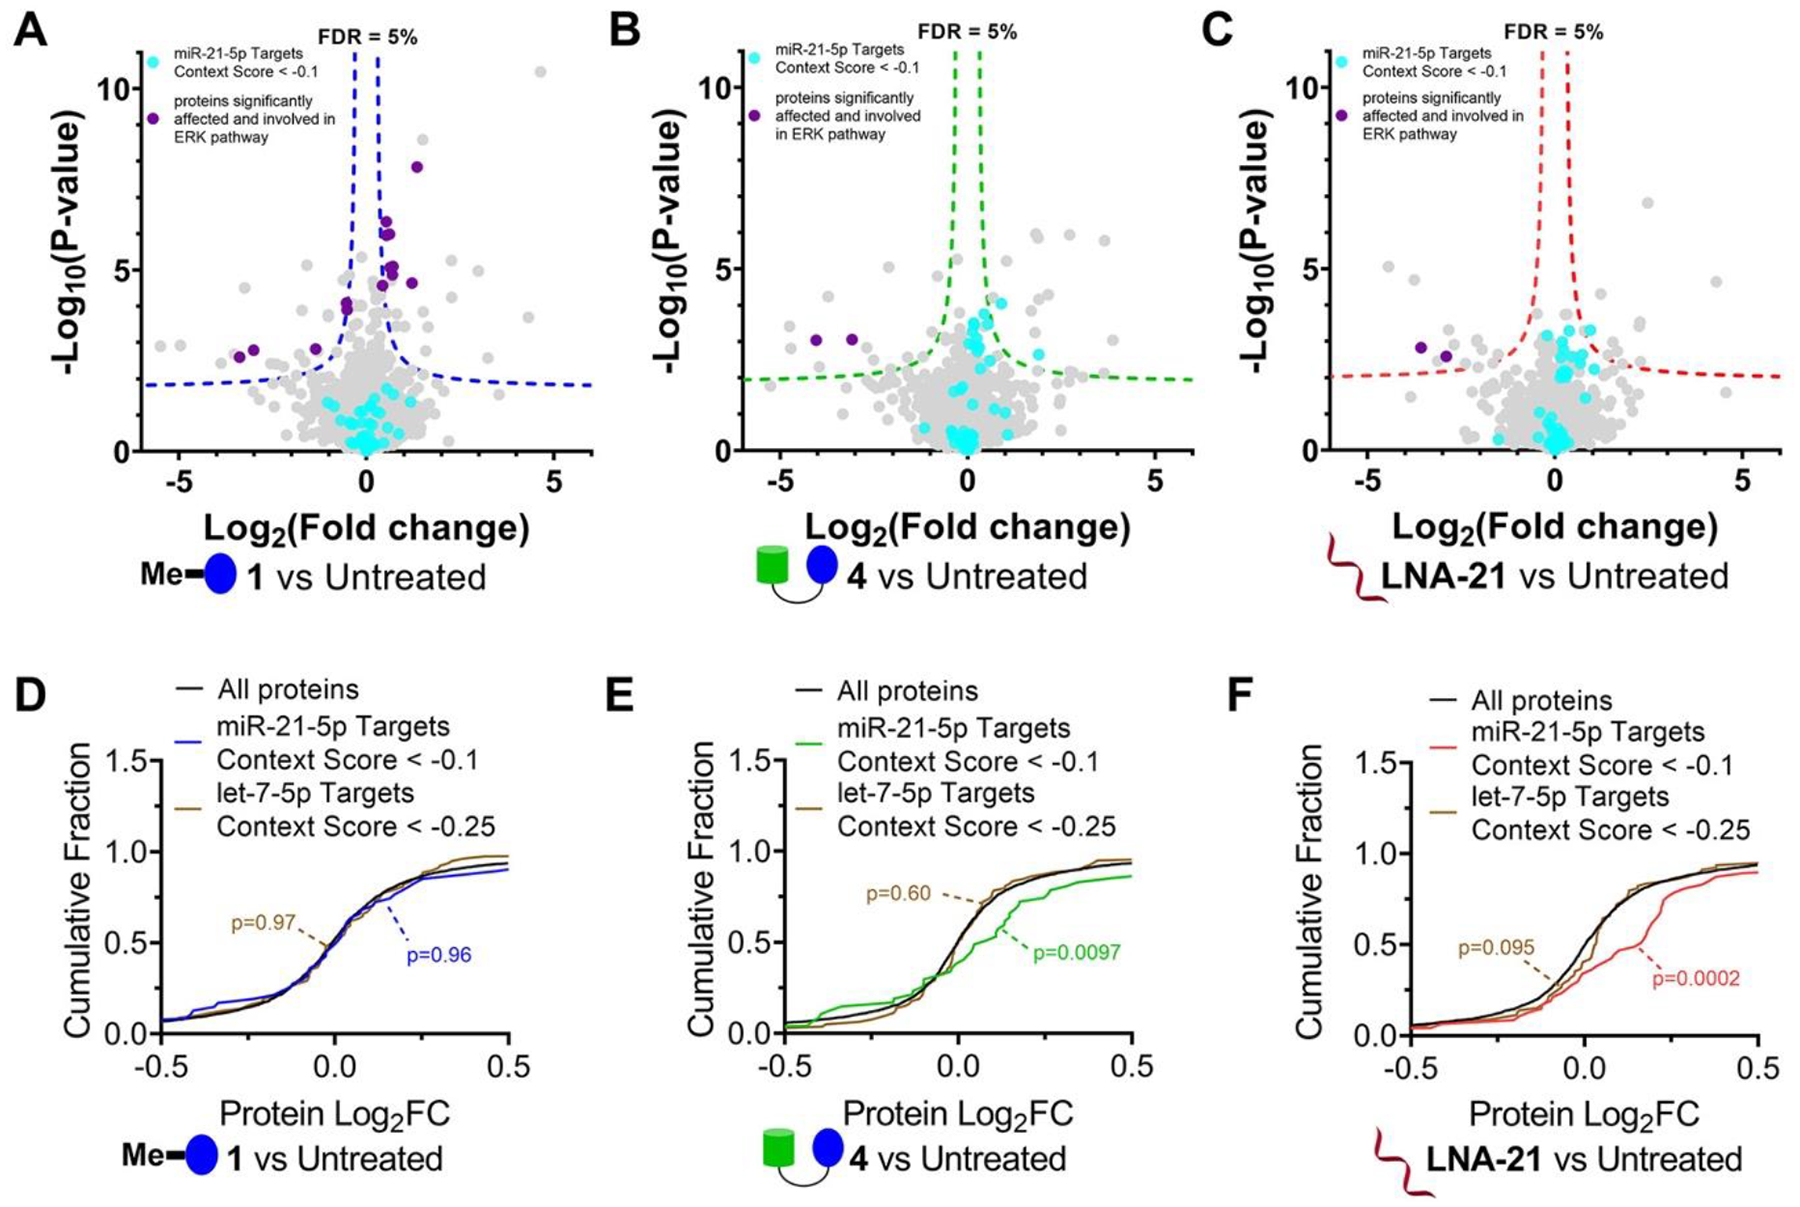
Figure 4.

Effects of 1, RIBOTAC 4, and LNA-21 on global protein expression in MDA-MB-231 cells. (A) Volcano plot showing proteome-wide changes induced by 1 (1 μM, a concentration that does not inhibit pre-miR-21 biogenesis but does inhibit RTKs) (n = 3). (B) Volcano plot showing proteome-wide changes triggered by RIBOTAC 4 (1 μM) (n = 3). (C) Volcano plot showing proteome-wide changes caused by LNA-21 (0.1 μM) (n = 3). Dotted lines represent a false discovery rate (FDR) of 5% and an S0 of 0.1. (D) Cumulative distribution plot shows no significant changes for miR-21 regulated proteins upon treatment with 1 μM of 1, a concentration that does not inhibit pre-miR-21 biogenesis. Proteins regulated by miR-21 were predicted by TargetScanHuman v7.2 (n = 390). Approximately 18% of miR-21–5p targets (70/390) were detectable in MDA-MB-231 cells. (E, F) Significant increase in abundance was observed for miR-21 regulated proteins upon treatment with 4 (1 μM; E) or LNA-21 (0.1 μM; F). As a control, we investigated changes in proteins regulated by let-7–5p, which has an abundance similar to that of miR-21 in MDA-MB-231 cells. Downstream protein targets of let-7–5p (n = 1207) were predicted by TargetScanHuman v7.2. Approximately 13% of let-7–5p targets (160/1207) were detectable in the global proteomics analysis. Targets for context + + scores < –0.1 or −0.25 in miR-21–5p or let-7–5p were calculated for cumulation distributions.
