Figure 2.

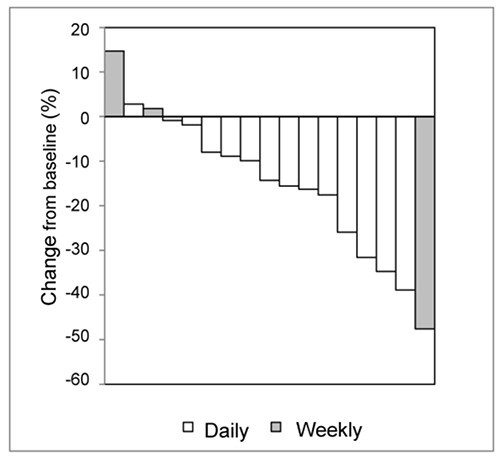
A waterfall plot of changes in tumor size from baseline in the STZ-naïve patients (14 in the daily regimen and 3 in the weekly regimen). Shaded bars represent patients receiving the weekly regimen.

A waterfall plot of changes in tumor size from baseline in the STZ-naïve patients (14 in the daily regimen and 3 in the weekly regimen). Shaded bars represent patients receiving the weekly regimen.