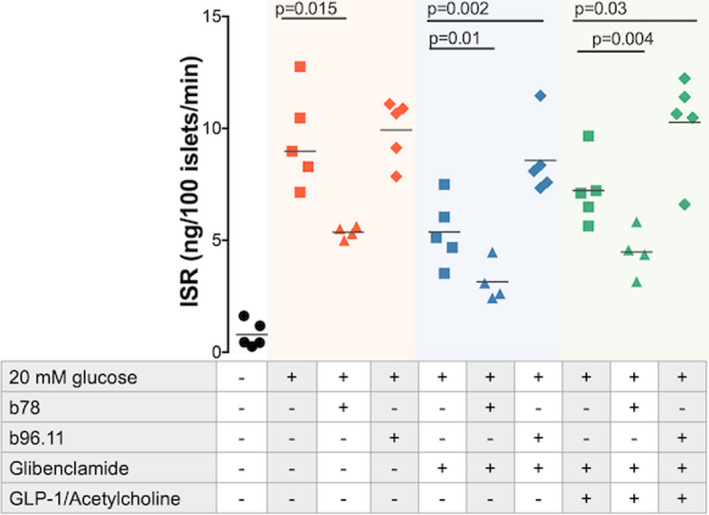
FIGURE 5.

Effect of antibodies on GSIS. Islets were pre‐incubated for 72 h in the presence of the indicated antibodies and reagents. Insulin secretion in the presence of 5mM glucose indicates the unstimulated (baseline) insulin secretion (black filled circles). Insulin secretion rate (ISR) is measured in the absence of antibody (filled squares), in the presence of b96.11 (2.6 μM) (triangles) and in the presence of b78 (2.6 μM) (diamonds). GSIS is measured in the absence (red symbols) and presence of glibenclamide (blue symbols) and presence of glibenclamide plus acetylcholine and GLP‐1 (green symbols). Insulin secretion was measured in the presence of 3 or 20 mM glucose (see Methods section for details). Data are plotted as the ratio of insulin secretion at 20 mM glucose over that at 3 mM glucose. The results of five independent experiments are presented. For some experiments, the data points overlap, so that not all five results are visible. The median is presented by the horizontal bar
