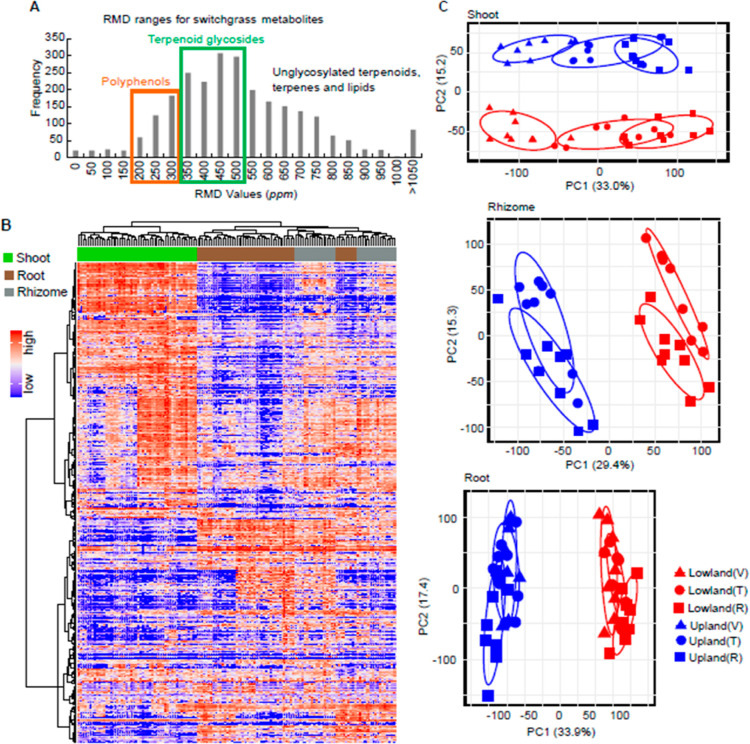
Figure 1.
Untargeted metabolome profiling for switchgrass. (A) Histogram of RMD values for the total 2586 features detected in this study by LC–MS in the positive ion mode. The green and orange rectangles highlight regions corresponding to the ranges of the RMD values anticipated for terpenoid glycosides and polyphenols, respectively. (B) Metabolome of the six switchgrass cultivars, three tissue types, and three developmental stages shown by a heatmap with HCA. The row and column clusters symbolize the 2586 features and 48 sample groups (containing 139 individual samples), respectively. The values representing the metabolite abundances that were used to make the heatmap were scaled to a range from 0 (the lowest abundance) to 1 (the highest abundance). (C) PCA score plots for the switchgrass shoot, rhizome, and root metabolite profiles (n = 8 for “upland vegetative” and “lowland reproductive”; n = 9 for all the other groups). The percentage of explained variation is shown on the x- and y-axes. V, vegetative phase; T, transition phase; and R, reproductive phase.

