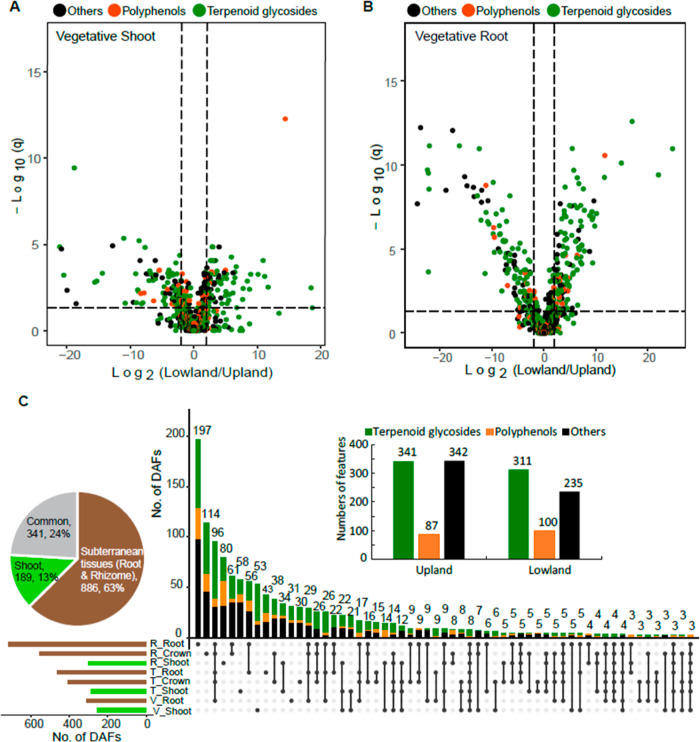
Figure 2.
DAFs were identified between the upland and lowland ecotypes. Significance analysis (cutoff threshold: FDR adjusted p ≤ 0.05; fold changes ≥2) was performed to screen for the DAFs between the upland and lowland switchgrass ecotypes (n = 8 or 9) in various developmental stage x tissue type samples. Results of the analyses for (A) vegetative-stage shoots and (B) vegetative-stage roots are shown here using volcano plots. Putative terpenoid glycosides, polyphenols, and metabolites from the other categories are classified using RMD filtering and the results color-coded. (C) Upset plot of the 1416 unique (non-overlapping) ecotype DAFs across the 8 developmental stage x tissue type sample groups. The rows and columns in the Upset plot represent the sets (the eight sample groups in this case) and their intersections, respectively. For each set that is part of a given intersection, a black filled circle is placed in the corresponding matrix cell; otherwise, a light-gray circle is shown. The numbers of DAFs in the intersections are shown as a bar chart above the matrix. The horizontal bar chart to the left of the matrix shows the size of each set. The inserted bar plot shows that upland and lowland ecotypes accumulated similar numbers of the predominant DAFs likely terpenoid glycosides (green) and polyphenols (orange). The inserted pie chart summarizes percentages of the DAFs contributed by aerial (shoot) vs subterranean (root/rhizome) tissues. V, vegetative phase; T, transition phase; and R, reproductive phase.

