Figure 3.
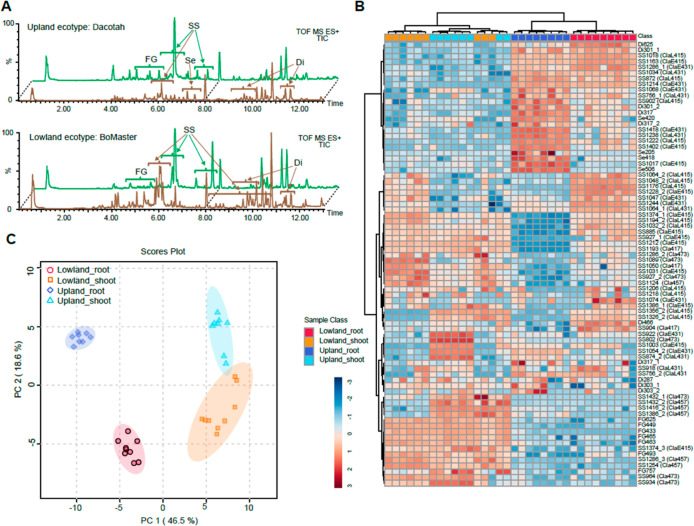
Upland and lowland ecotypes are distinct in specialized metabolite profiles. (A) TICs for upland Dacotah and lowland BoMaster shoot (green) and root (brown) extracts. Areas where the specialized metabolites were identified are labeled by the short names. FG, flavonoid glycoside; ESS, early-eluting steroidal saponin; LSS, late-eluting steroidal saponin; TS, triterpenoid saponin; Di, diterpenoid; and Se, sesquiterpenoid. (B) Heatmap showing relative abundances of the specialized metabolites (vertical axis) across the biological samples (horizontal axis). Classifications of the saponins are shown in the parentheses. Relative metabolite abundances were log10-scaled to a range between −3 (lowest) and 3 (highest). Clustering method/distance: Ward/Euclidean. (C) PCA score plot showing distinct separations of the specialized metabolite profiles among the upland shoot, upland root, lowland shoot, and lowland root.

