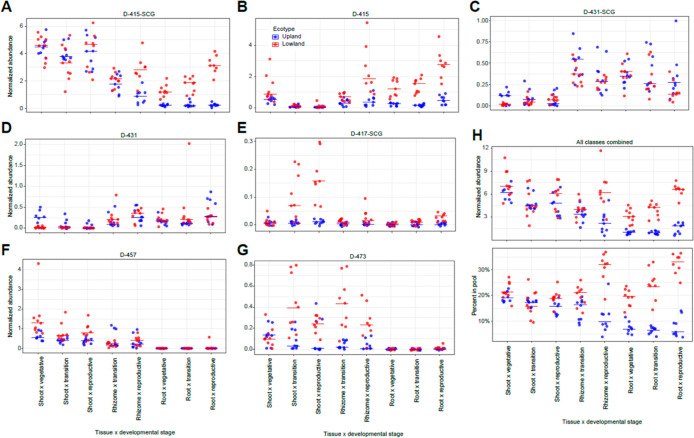
Figure 5.
Relative quantification of individual saponin classes and total saponins. (A–G) Accumulative ion counts for each individual saponin classes and (H, lower panel) the total saponins (all classes combined) from the eight tissue type x developmental stage sample classes measured by positive-mode LC–MS. (H, lower panel) Percentages of the saponins in the total ion pools. Normalized abundances (y-axis) are calculated as (ion intensity of the feature/ion intensity of the internal standard). For all panels, the horizontal bars represent median values (n = 8 or 9). Red, lowland ecotype; blue, upland ecotype.

