Figure 6.
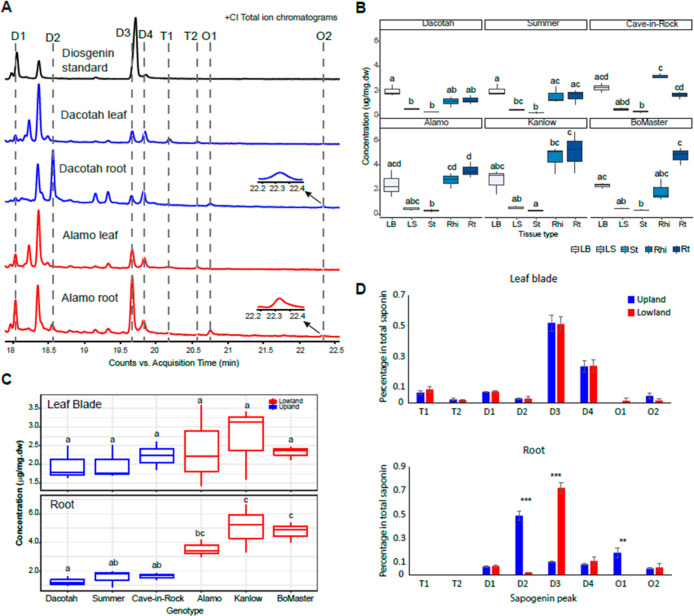
Sapogenin aglycone peaks identified in switchgrass extracts are quantified by GC–MS. (A) +(CI) GC–MS TICs of the diosgenin standard (black), Dacotah leaf and root (blue), and Alamo leaf root (red). The identified sapogenin aglycone peaks in the switchgrass and standard samples are indicated and aligned by the dashed lines. Zoomed-in views for the peak O2 in the Dacotah root and Alamo root are indicated by the arrows. (B) Comparison of the total sapogenin concentrations among the five tissue types for each switchgrass cultivar (Kruskal–Wallis test: p = 0.012, 0.026, 0.009, 0.024, 0.017, and 0.011 for Dacotach, Summer, Cave-in-Rock, Alamo, Kanlow, and BoMaster, respectively). LB, leaf blade; LS, leaf sheath, St, stem; Rhi, rhizome; and Rt, root. (C) Comparison of the total sapogenin among the six switchgrass cultivars in the leaf blade (Kruskal–Wallis test: p = 0.766) and root (Kruskal–Wallis test, p = 0.016). Different lower-case letters on top of the boxes designate statistically different means (post-hoc test: Dunn’s test). (D) Ratio of the individual sapogenins in the leaf blade (upper) and root (lower) of upland and lowland ecotypes. Heights of the bars reflect the means of the nine replicates (three cultivars × three replicates) for each ecotype; error bars show the standard error of the mean; ** standards for 0.001 ≤ p ≤ 0.01 and *** standards for p < 0.001 (one-tailed t-test).

