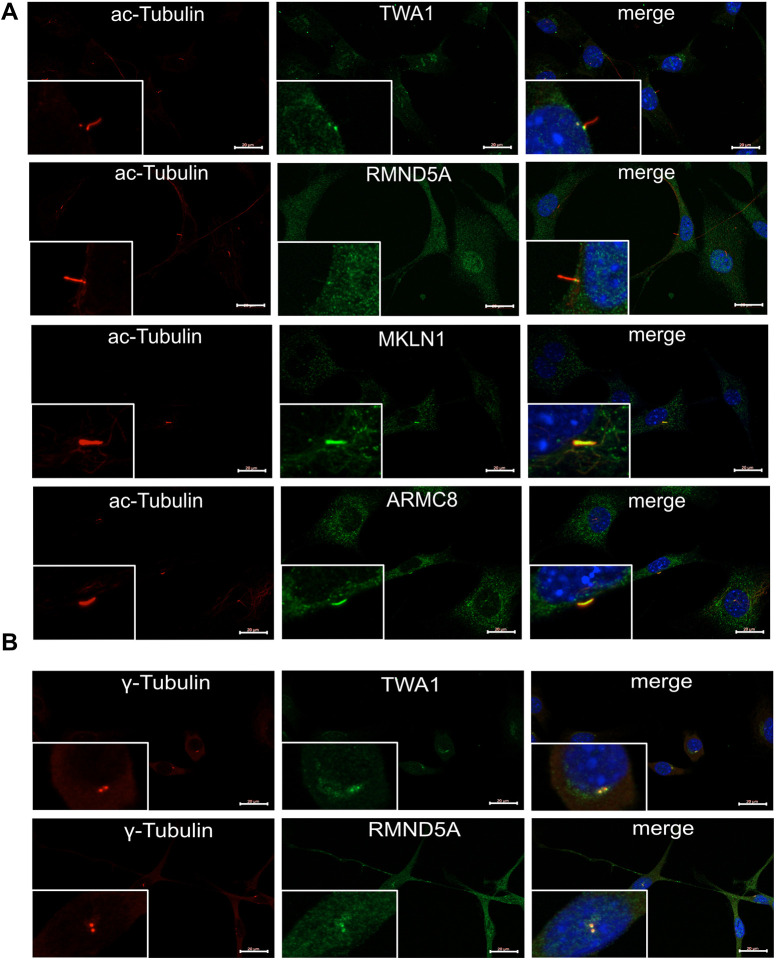
Fig. 2.
GID complex subunits colocalize with primary cilia and centrioles. (A) Cells were serum-starved (high glucose DMEM, 0.5% FCS) for 24 h to induce ciliogenesis. After fixation, cells were stained for acetylated tubulin (ac-tubulin) to visualize the axoneme of the primary cilium. Additional antibodies were diluted 1:100 in PBS containing 3% BSA and 0.3% Tween-20 and used to visualize subunits of the GID complex (TWA1, RMND5A, MKLN1 and ARMC8). Nuclei were stained using DAPI (blue). (B) As described in A without prior serum starvation and stained for γ-tubulin to visualize the basal body of the primary cilium. Images in A and B were merged to identify overlapping signals (merge, yellow). Inset images show a cell with a primary cilium at original size at the respective magnifications. Scale bars: 20 μm. Percentage of cells with ac-Tubulin colocalization: TWA1, 75.9%, n=29; RMND5A, 60.7%, n=28; ARMC8, 96.3%, n=27; MKLN1, 93.1%, n=29. Percentage of cells with γ-tubulin colocalization: TWA1, 87.1%, n=31; RMND5A, 82.8%, n=29; n=total number of cells investigated.

