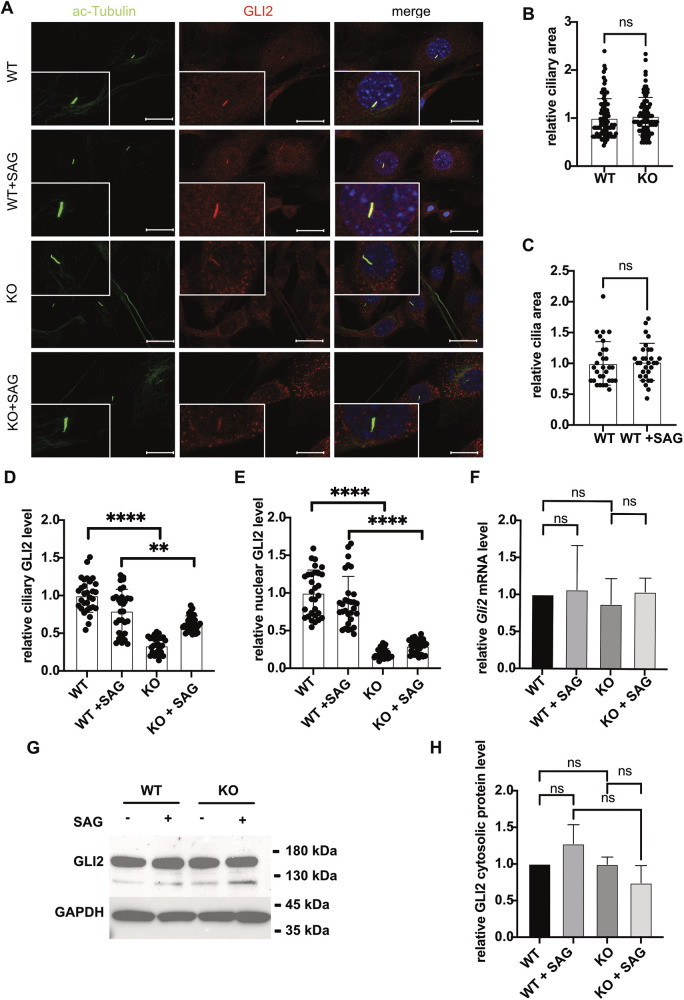
Fig. 5.
Reduction of GID complex function results in aberrant protein homeostasis in primary cilia. (A) Representative microscope images of GLI2 localization. WT and KO cells were treated with cilia-inducing medium (high-glucose DMEM with 0.5% FCS) for 24 h with or without SAG and then fixed. Axonemes were stained with anti-acetylated TUBA4A (ac-tubulin) antibody (green); anti-GLI2 antibody (red) was used to visualize GLI2 protein, and DAPI (blue) was used to stain DNA. Inset images show magnification of a primary cilium. Scale bars: 20 μm. (B) Relative ciliary area of WT and KO. Relative cilia area was measured in the area demarcating the axoneme (green) in WT and KO cells, and the WT average set to 1. Mean±s.e.m.; n=90 (WT), n=90 (KO). ns, P>0.05 (two-tailed, unpaired Student's t-test). (C) Relative ciliary area of WT and WT+SAG. Relative cilia area was measured in the area demarcating the axoneme (green) in WT and WT+SAG cells, with the WT average set to 1. Mean±s.e.m.; n=30 (WT), n=30 (KO). ns, P>0.05 (two-tailed, unpaired Student's t-test). (D) Relative ciliary GLI2 protein level. GLI2 (red) and ac-Tubulin (green) fluorescence intensity was measured in the area demarcating the axoneme (green) in WT and KO cells with or without SAG (100 nM). Intensity was normalized to the level of ac-tubulin. Mean±s.e.m.; n=30 (WT), n=30 (WT+SAG), n=30 (KO), n=30 (KO+SAG). ****P<0.0001; **P=0.0038 (two-tailed, unpaired Student's t-test). (E) Relative nuclear GLI2 protein level. GLI2 fluorescence intensity (red) was measured in the area demarcating the nucleus (blue) in WT and KO cells with or without SAG (100 nM) and normalized to the signal intensity of DAPI. Mean±s.e.m.; n=30 (WT), n=30 (WT+SAG), n=30 (KO), n=30 (KO+SAG). ****P<0.0001 (two-tailed, unpaired Student's t-test). (F) qPCR of relative Gli2 levels in WT and KO cells. Cells were cultured under cilia-induced condition (high glucose DMEM, 0.5% FCS) with or without SAG (100 nM) treatment for 24 h, as indicated, and harvested for further analysis. Mean±s.e.m., n=6. ns, P>0.05 (two-tailed, unpaired Student's t-test). (G) Western blot analysis of cytosolic GLI2 in WT and KO cells. Cells were cultured under cilia-induced condition (high glucose DMEM, 0.5% FCS) with or without SAG (100 nM) treatment for 24 h. GAPDH was used as a loading control. (H) Quantification of western blot signals as in G, showing the relative ratio between cytosolic GLI2 and GAPDH. Mean±s.e.m., n=3. ns, P>0.05 (two-tailed, unpaired Student's t-test).

