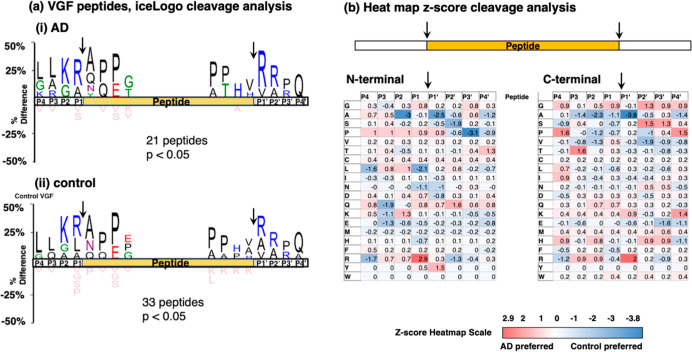
Figure 7.
VGF peptide cleavage site analysis in AD compared to controls. (a) IceLogo analysis. IceLogo shows the relative frequencies of residues at the P4 to P4′ positions of N- and C-terminal cleavages of neuropeptides derived from VGF in AD (panel i) and control (panel ii) synaptosomes. Color codes for amino acids indicate acidic residues in red, basic residues in blue, polar residues in green, nonpolar residues in black, asparagine in purple, and residues never found in pink. (b) Heatmap comparison of preferred residues at N- and C-termini of neuropeptides within VGF. The heatmap shows z-scores that indicate the frequency of amino acid residues at P4 to P4′ positions of cleavage sites at N-termini and C-termini of neuropeptides within VGF.

