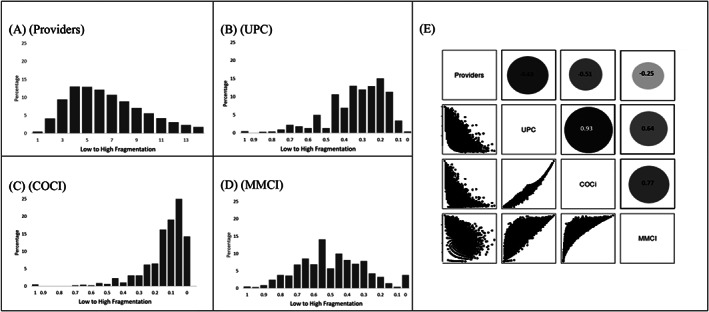
FIGURE 1.

Fragmentation measure distributions and correlations. Panels A‐D illustrate the study population's fragmentation by (A) number of providers, (B) Usual Provider of Care (UPC), (C) Bice‐Boxerman's Continuity of Care Index (COCI), (D) Modified Modified Continuity Index (MMCI). Panel E illustrates the correlation among fragmentation measures using scatter plots, with the strength of correlation reflected by the corresponding circle size and density
