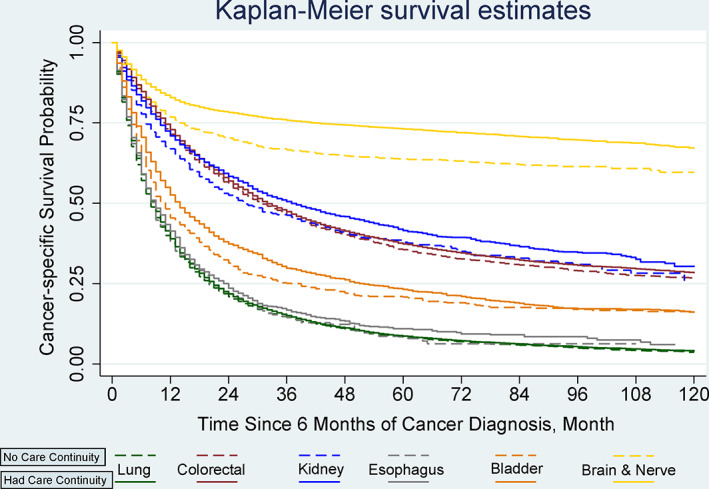
FIGURE 2.

Kaplan–Meier Survival Curves for cancer‐specific survival by primary care physician continuity and primary tumor type. Overall cancer‐specific survival was analyzed based on primary tumor sites by whether a patient followed up with their primary care physician within the 6 months after a diagnosis of poor‐prognosis cancer. Survival was compared using Kaplan–Meier analysis (log‐rank tests). The cancer‐specific survival was significantly different between patients who had primary care physician continuity and patients who had no care continuity for patients diagnosed with lung (p = 0.001), colorectal (p = 0.005), kidney cancer (p = 0.038), bladder cancer (p = 0.002), and brain cancer(p < 0.001), but not different for esophagus (p = 0.420) [Color figure can be viewed at wileyonlinelibrary.com]
