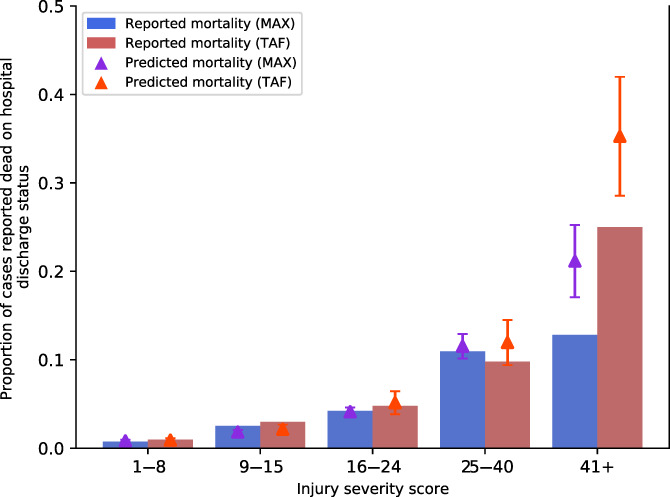
FIGURE 1.

Reported versus predicted mortality in Medicaid fee‐for‐service cases, by injury severity score (95% confidence intervals for predicted mortality shown). MAX, Medicaid Analytic eXtract, TAF, Transformed Medicaid Statistical Information System (T‐MSIS) Analytic Files. The number of MAX fee‐for‐service observations in the new injury severity score bins 1–8, 9–15, 16–24, 25–40, and 41+ are 7641, 5499, 2155, 713, and 78, respectively. The number of TAF fee‐for‐service observations in the new injury severity score bins 1–8, 9–15, 16–24, 25–40, and 41+ are 4508, 1373, 606, 347, and 84, respectively. We trained the logit model using those aged 65–73 in the Medicare population and predicted mortality on those aged 50–64 in the Medicaid population. 95% confidence intervals for predictions in each bin are shown [Color figure can be viewed at wileyonlinelibrary.com]
