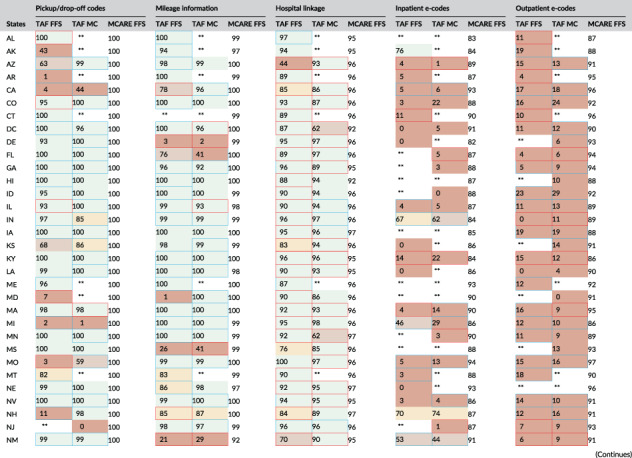
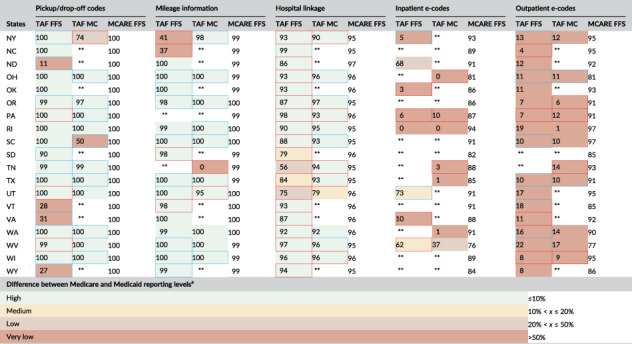
TABLE 3.
TAF performance on data quality indicators by state and insurance program (percentages shown)

| |||||||||||||||

|
Note: ** is placed in cells that contained too few claims to meet the minimum cell size requirements of our data use agreement with the Centers for Medicare and Medicaid Services.
Abbreviations: MCARE FFS, Medicare fee‐for‐service; e‐code, externcal cause of injury code; TAF FFS, Transformed Medicaid Statistical Information System (T‐MSIS) Analytic Files fee‐for‐service; TAF MC, T‐MSIS Analytic Files managed care.
The data quality was indicated as high, medium, low, or very low if the percentage point difference with Medicare falls within the interval. We compared the same year (2016) between TAF and Medicare. When comparing rates strictly between MAX and TAF, a cell with blue borders represents a statistically significant increase from MAX and a cell with red borders represents a statistically significant decrease from MAX, at an alpha level of 0.05.
[Correction added on 12 March 2022, after first online publication: Table 3 has been corrected in this version.]
